
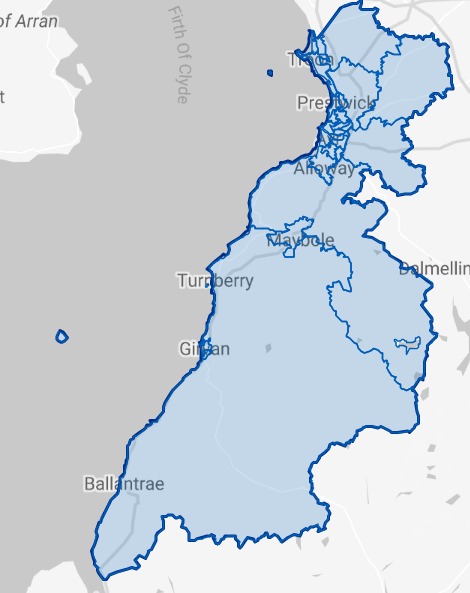
South Ayrshire Local Authority
Please note, this report uses the definition of “long term empty” (LTE) used by National Records Scotland (NRS): “homes empty for 6+ months (and liable for council tax).” Figures published by NRS show that South Ayrshire had 782* LTE homes in 2024. The table below shows how these LTE homes are distributed across the Local Authority area.
• 1.38% of South Ayrshire’s homes were LTE in 2024, compared to 1.80% in Scotland as a whole.
• 38.53% (326) of South Ayrshire’s empty homes have been empty for longer than one year**.
• South Ayrshire accounts for 1.03% of homes empty for more than 1 year in Scotland.
Empty homes contact for South Ayrshire:
Kyle McKay (Policy Officer) [email protected]
Please click on the map above to go to the Statistics.Gov.UK page for South Ayrshire. You can find out the location of each of the Intermediate Data Zones by clicking on 2011 Intermediate Zones under Locations on that page
| Intermediate Data Zones | # of LTE Homes | Change 2023-2024 | % of Properties LTE | % of SA LTE homes | % of SA Homes | |
|---|---|---|---|---|---|---|
| 1 | Carrick South | 101 | +11 | 3.62% | 12.92% | 4.91% |
| 2 | Ayr South Harbour and Town Centre | 100 | 0 | 3.08% | 12.79% | 5.72% |
| 3 | Ayr North Harbour, Wallacetown and Newton South | 89 | -1 | 2.82% | 11.38% | 5.56% |
| 4 | Troon | 53 | -3 | 1.84% | 6.78% | 5.07% |
| 5 | Girvan Ailsa | 49 | -10 | 2.71% | 6.27% | 3.18% |
| 6 | Maybole | 38 | -3 | 1.65% | 4.86% | 4.06% |
| 7 | Annbank, Mossblown and Tarbolton - the Coalfields | 35 | -7 | 1.29% | 4.48% | 4.79% |
| 8 | Barassie | 31 | -4 | 1.42% | 3.96% | 3.84% |
| 9 | Alloway and Doonfoot | 27 | +8 | 0.98% | 3.45% | 4.85% |
| 10 | Newton North | 25 | -2 | 1.13% | 3.20% | 3.89% |
| 11 | Carrick North | 24 | -7 | 1.04% | 3.07% | 4.06% |
| 12 | Prestwick West | 24 | +5 | 1.17% | 3.07% | 3.61% |
| 13 | Prestwick Airport and Monkton | 23 | +4 | 1.44% | 2.94% | 2.82% |
| 14 | Girvan Glendoune | 20 | +9 | 1.24% | 2.56% | 2.85% |
| 15 | Belmont | 20 | -14 | 0.79% | 2.56% | 4.45% |
| 16 | Dundonald, Loans and Symington | 20 | +2 | 0.62% | 2.56% | 5.68% |
| 17 | Lochside, Braehead and Whitletts | 17 | +1 | 0.80% | 2.17% | 3.72% |
| 18 | Castlehill and Kincaidston | 16 | +1 | 0.79% | 2.05% | 3.58% |
| 19 | Heathfield | 14 | -3 | 0.69% | 1.79% | 3.56% |
| 20 | Prestwick East | 14 | -7 | 0.55% | 1.79% | 4.51% |
| 21 | Muirhead | 11 | -4 | 0.47% | 1.41% | 4.10% |
| 22 | Coylton | 8 | -8 | 0.48% | 1.02% | 2.95% |
| 23 | Craigie | 8 | -3 | 0.69% | 1.02% | 2.03% |
| 24 | Dalmilling | 8 | +1 | 0.63% | 1.02% | 2.24% |
| 25 | Holmston and Forehill | 7 | -4 | 0.31% | 0.90% | 3.98% |
Where the % of homes is lower than % of LTE homes, it indicates areas with above average levels of empty homes.
For a full version of this report please contact the partnership’s data analyst at [email protected]
*This differs from the 6+ month empty figure published by Scottish Gov for South Ayrshire- 846
**According to data published by SG
Sources