
Renfrewshire Local Authority
Figures published by National Records of Scotland show that Renfrewshire had 796 long-term empty homes in 2023. The table below shows how these long term empty homes are distributed across the Local Authority area.
• 0.87% of Renfrewshire’s homes were long term empty in 2023, compared to 1.70% in Scotland as a whole.
• 49.50% (394) of Renfrewshire’s long term empty homes have been empty for longer than one year.
• Renfrewshire accounts for 1.39% of homes empty for more than 1 year in Scotland.
Renfrewshire’s More Homes Officer
Allana Mcluskey (07811055016)
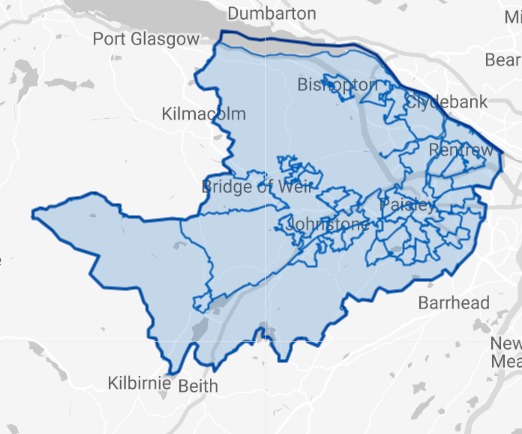
Please click on the map above to go to the Statistics.Gov.UK page for Renfrewshire. You can find out the location of each of the Intermediate Data Zones by clicking on 2011 Intermediate Zones under Locations on that page
| Intermediate Data Zones | Number of LTE Homes | Increase or Decrease 2022-2023 | % of Properties LTE | % of Ren LTEs | % of Ren Homes | |
|---|---|---|---|---|---|---|
| 1 | Paisley North West | 84 | -14 | 3.25% | 10.55% | 2.83% |
| 2 | Paisley Central | 75 | +3 | 1.49% | 9.42% | 5.51% |
| 3 | Paisley North East | 53 | 0 | 1.50% | 6.66% | 3.86% |
| 4 | Renfrew North | 41 | +10 | 1.03% | 5.15% | 4.38% |
| 5 | Paisley Gallowhill and Hillington | 40 | +1 | 1.39% | 5.03% | 3.15% |
| 6 | Johnstone North East | 34 | -1 | 1.70% | 4.27% | 2.19% |
| 7 | Paisley North | 34 | +4 | 1.07% | 4.27% | 3.48% |
| 8 | Paisley South East | 34 | -3 | 0.97% | 4.27% | 3.85% |
| 9 | Johnstone North West | 33 | +2 | 1.76% | 4.15% | 2.05% |
| 10 | Paisley Foxbar | 32 | +17 | 1.27% | 4.02% | 2.77% |
| 11 | Paisley Ferguslie | 26 | +3 | 1.24% | 3.27% | 2.30% |
| 12 | Renfrewshire Rural North and Langbank | 25 | +2 | 0.56% | 3.14% | 4.88% |
| 13 | Linwood South | 22 | +3 | 1.05% | 2.76% | 2.29% |
| 14 | Renfrew West | 21 | -8 | 0.63% | 2.64% | 3.66% |
| 15 | Paisley West | 19 | +2 | 0.74% | 2.39% | 2.80% |
| 16 | Johnstone South East | 18 | -4 | 0.89% | 2.26% | 2.21% |
| 17 | Paisley Glenburn East | 17 | +2 | 1.00% | 2.14% | 1.86% |
| 18 | Bridge of Weir | 15 | -4 | 0.69% | 1.88% | 2.39% |
| 19 | Johnstone South West | 15 | +8 | 0.59% | 1.88% | 2.80% |
| 20 | Renfrewshire Rural South and Howwood | 14 | 0 | 0.85% | 1.76% | 1.81% |
| 21 | Paisley Glenburn West | 13 | +2 | 0.75% | 1.63% | 1.90% |
| 22 | Renfrew South | 13 | +1 | 0.52% | 1.63% | 2.73% |
| 23 | Paisley South | 12 | +2 | 0.72% | 1.51% | 1.83% |
| 24 | Paisley East | 12 | -7 | 0.50% | 1.51% | 2.63% |
| 25 | Kilbarchan | 11 | +5 | 0.68% | 1.38% | 1.77% |
| 26 | Erskine East and Inchinnan | 10 | +5 | 0.43% | 1.26% | 2.53% |
| 27 | Renfrew East | 10 | -3 | 0.40% | 1.26% | 2.74% |
| 28 | Houston North | 9 | +3 | 0.70% | 1.13% | 1.41% |
| 29 | Lochwinnoch | 9 | 0 | 0.69% | 1.13% | 1.42% |
| 30 | Linwood North | 8 | +1 | 0.40% | 1.01% | 2.17% |
| 31 | Paisley Ralston | 8 | +4 | 0.39% | 1.01% | 2.24% |
| 32 | Paisley South West | 8 | +2 | 0.38% | 1.01% | 2.29% |
| 33 | Elderslie and Phoenix | 6 | -10 | 0.23% | 0.75% | 2.83% |
| 34 | Erskine West | 4 | -8 | 0.17% | 0.50% | 2.65% |
| 35 | Paisley Dykebar | 3 | +1 | 0.18% | 0.38% | 1. 83% |
| 36 | Bishopton | 3 | -1 | 0.15% | 0.38% | 2.14% |
| 37 | Erskine Central | 3 | -4 | 0.14% | 0.38% | 2.37% |
| 38 | Houston South | 2 | -2 | 0.15% | 0.25% | 1.44% |
Where the % of homes is lower than % of long term empty homes, it indicates areas with above average levels of empty homes.
Sources
Small Area Statistics on Households and Dwellings | National Records of Scotland (nrscotland.gov.uk)
Housing statistics: Empty properties and second homes – gov.scot (www.gov.scot)