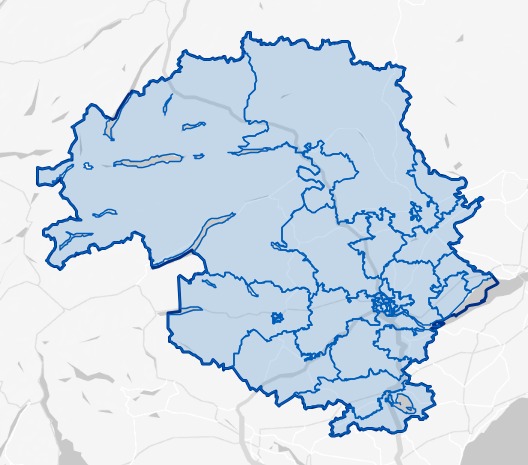
Perth & Kinross Local Authority
Figures published by National Records of Scotland show that Perth & Kinross had 1,275 long-term empty homes in 2023. The table below shows how these long term empty homes are distributed across the Local Authority area.

• 1.67% of Perth & Kinross homes were long term empty in 2023, compared to 1.70% in Scotland as a whole.
• 60.86% (776) of Perth & Kinross long term empty homes have been empty for longer than one year.
• Perth & Kinross accounts for 2.74% of homes empty for more than 1 year in Scotland.
Perth & Kinross Vacant Property Development Officer
Thomas Waterworth ([email protected])
Please click on the map above to go to the Statistics.Gov.UK page for Perth & Kinross. You can find out the location of each of the Intermediate Data Zones by clicking on 2011 Intermediate Zones under Locations on that page
| Intermediate Data Zones | Number of LTE Homes | Increase or Decrease 2022-2023 | % of Properties LTE | % of P&K LTEs | % of P&K Homes | |
|---|---|---|---|---|---|---|
| 1 | Central and South Inch | 150 | -1 | 4.64% | 11.76% | 4.25% |
| 2 | Rannoch and Aberfeldy | 86 | -6 | 2.89% | 6.75% | 3.91% |
| 3 | Blair Atholl, Strathardle and Glenshee | 78 | +18 | 3.15% | 6.12% | 3.25% |
| 4 | Coupar Angus and Meigle | 56 | +8 | 2.20% | 4.39% | 3.34% |
| 5 | Comrie, Gilmerton and St Fillans | 54 | +5 | 2.66% | 4.24% | 2.67% |
| 6 | Luncarty and Dunkeld | 53 | -7 | 1.69% | 4.16% | 4.12% |
| 7 | Muthill, Greenloaning and Gleneagles | 51 | +4 | 2.49% | 4.00% | 2.69% |
| 8 | North Inch | 51 | -29 | 3.73% | 4.00% | 1.80% |
| 9 | Pitlochry | 47 | +6 | 2.29% | 3.69% | 2.70% |
| 10 | Stanley and Murthly | 42 | 0 | 1.84% | 3.29% | 3.00% |
| 11 | Crieff South | 41 | 0 | 1.94% | 3.22% | 2.78% |
| 12 | Alyth | 40 | +15 | 2.50% | 3.14% | 2.10% |
| 13 | Blairgowrie West | 39 | -1 | 1.35% | 3.06% | 3.79% |
| 14 | Aberuthven and Almondbank | 38 | +3 | 1.61% | 2.98% | 3.09% |
| 15 | Guildtown, Balbeggie and St Madoes | 34 | +6 | 1.75% | 2.67% | 2.55% |
| 16 | Auchterarder | 33 | +4 | 1.63% | 2.59% | 2.67% |
| 17 | Viewlands, Craigie and Wellshill | 32 | -2 | 1.10% | 2.51% | 3.82% |
| 18 | Glenfarg, Dunning and Rhynd | 29 | +6 | 1.35% | 2.27% | 2.82% |
| 19 | Powmill, Cleish and Scotlandwell | 26 | +2 | 1.36% | 2.04% | 2.51% |
| 20 | Crieff North | 25 | +3 | 1.68% | 1.96% | 1.95% |
| 21 | Hillyland, Tulloch and Inveralmond | 25 | +3 | 0.94% | 1.96% | 3.51% |
| 22 | Bridge of Earn and Abernethy | 23 | -3 | 0.93% | 1.80% | 3.24% |
| 23 | Gannochy and Walnut Grove | 22 | +5 | 1.25% | 1.73% | 2.32% |
| 24 | Errol and Inchture | 22 | -4 | 1.16% | 1.73% | 2.48% |
| 25 | Milnathort and Crook of Devon | 21 | +4 | 1.14% | 1.65% | 2.43% |
| 26 | Kinross | 20 | -1 | 0.84% | 1.57% | 3.15% |
| 27 | Letham | 20 | +2 | 0.75% | 1.57% | 3.52% |
| 28 | Invergowrie, Longforgan and Abernyte | 19 | -1 | 1.08% | 1.49% | 2.32% |
| 29 | Blairgowrie East (Rattray) | 19 | +1 | 1.28% | 1.49% | 1.95% |
| 30 | Scone | 18 | -8 | 0.69% | 1.41% | 3.41% |
| 31 | Muirton | 15 | -5 | 0.87% | 1.18% | 2.28% |
| 32 | Moncrieffe and Friarton | 13 | -6 | 0.73% | 1.02% | 2.33% |
| 33 | North Muirton and Old Scone | 13 | -4 | 0.81% | 1.02% | 2.10% |
| 34 | Burghmuir and Oakbank | 10 | -5 | 0.51% | 0.78% | 2.56% |
| 35 | Western Edge | 10 | -1 | 0.50% | 0.78% | 2.62% |
Where the % of homes is lower than % of long term empty homes, it indicates areas with above average levels of empty homes.
Sources
Small Area Statistics on Households and Dwellings | National Records of Scotland (nrscotland.gov.uk)
Housing statistics: Empty properties and second homes – gov.scot (www.gov.scot)
