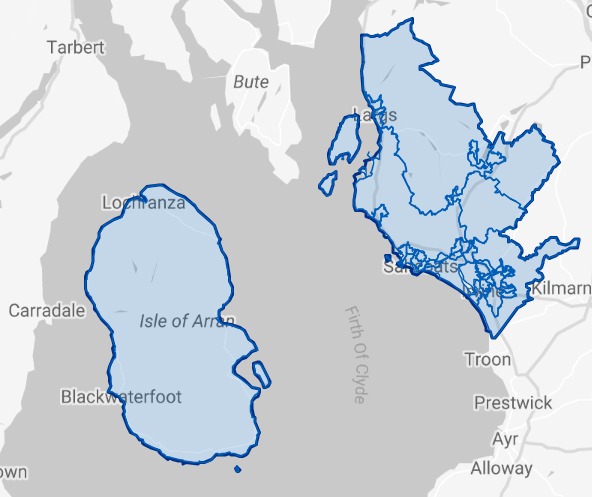
North Ayrshire Local Authority
Figures published by National Records of Scotland show that North Ayrshire had 1,041 long-term empty homes in 2023. The table below shows how these long term empty homes are distributed across the Local Authority area.
• 1.48% of North Ayrshire’s homes were long term empty in 2023, compared to 1.70% in Scotland as a whole.
• 53.22% (554) of North Ayrshire’s long term empty homes have been empty for longer than one year.
• North Ayrshire accounts for 1.96% of homes empty for more than 1 year in Scotland.
North Ayrshire Private Sector Team – Housing Services
Emma Anderson (01294 324644)
Please click on the map above to go to the Statistics.Gov.UK page for North Ayrshire. You can find out the location of each of the Intermediate Data Zones by clicking on 2011 Intermediate Zones under Locations on that page
| Intermediate Data Zones | Number of LTE Homes | Increase or Decrease 2022-2023 | % of Properties LTE | % of NA LTEs | % of NA Homes | |
|---|---|---|---|---|---|---|
| 1 | Largs Central and Cumbrae | 96 | -21 | 2.69% | 9.22% | 5.09% |
| 2 | Arran | 83 | +17 | 2.62% | 7.97% | 4.52% |
| 3 | Saltcoats Central | 67 | -16 | 2.87% | 6.44% | 3.32% |
| 4 | Ardrossan Central | 48 | -3 | 2.53% | 4.61% | 2.70% |
| 5 | Saltcoats North West | 45 | +8 | 2.78% | 4.32% | 2.30% |
| 6 | Largs South | 35 | +10 | 1.69% | 3.36% | 2.96% |
| 7 | Beith East and Rural | 34 | +4 | 1.78% | 3.27% | 2.72% |
| 8 | Irvine Central | 33 | +10 | 1.87% | 3.17% | 2.51% |
| 9 | Fairlie and Rural | 33 | +19 | 1.79% | 3.17% | 2.63% |
| 10 | Dalry East and Rural | 32 | +2 | 2.04% | 3.07% | 2.24% |
| 11 | Skelmorlie and Rural | 31 | 0 | 2.04% | 2.98% | 2.17% |
| 12 | West Kilbride and Seamill | 30 | +6 | 1.30% | 2.88% | 3.30% |
| 13 | Stevenston Hayocks | 28 | +12 | 1.50% | 2.69% | 2.67% |
| 14 | Irvine Bourtreehill | 26 | +7 | 2.43% | 2.50% | 1.53% |
| 15 | Stevenston Ardeer | 26 | +3 | 1.72% | 2.50% | 2.15% |
| 16 | Stevenston North West | 26 | +10 | 1.72% | 2.50% | 2.15% |
| 17 | Kilwinning Central and North | 26 | +7 | 1.38% | 2.50% | 2.69% |
| 18 | Kilbirnie South and Longbar | 25 | -7 | 1.17% | 2.40% | 3.04% |
| 19 | Largs North | 24 | +1 | 1.13% | 2.31% | 3.01% |
| 20 | Kilbirnie North | 24 | -4 | 1.59% | 2.31% | 2.15% |
| 21 | Kilwinning West and Blacklands | 22 | +11 | 1.04% | 2.11% | 3.00% |
| 22 | Beith West | 22 | +7 | 1.50% | 2.11% | 2.09% |
| 23 | Springside and Rural | 21 | +5 | 1.36% | 2.02% | 2.20% |
| 24 | Irvine Fullarton | 19 | +10 | 1.07% | 1.83% | 2.53% |
| 25 | Kilwinning Pennyburn | 19 | +2 | 1.30% | 1.83% | 2.08% |
| 26 | Irvine Girdle Toll and Staneca | 18 | +9 | 0.81% | 1.73% | 3.15% |
| 27 | Kilwinning Whitehirst Park and Woodside | 18 | +4 | 0.85% | 1.73% | 3.01% |
| 28 | Dalry West | 18 | +4 | 1.29% | 1.73% | 1.99% |
| 29 | Irvine East | 17 | +11 | 1.08% | 1.63% | 2.24% |
| 30 | Ardrossan North East | 15 | +2 | 0.75% | 1.44% | 2.85% |
| 31 | Saltcoats North East | 14 | +7 | 0.64% | 1.34% | 3.12% |
| 32 | Irvine Broomlands | 12 | +6 | 0.98% | 1.15% | 1.75% |
| 33 | Ardrossan North West | 12 | 0 | 0.77% | 1.15% | 2.22% |
| 34 | Irvine Castlepark North | 11 | +2 | 0.72% | 1.06% | 2.16% |
| 35 | Irvine Perceton and Lawthorn | 10 | +3 | 0.50% | 0.96% | 2.84% |
| 36 | Irvine Castlepark South | 9 | 0 | 0.55% | 0.86% | 2.32% |
| 37 | Dreghorn | 8 | +1 | 0.49% | 0.77% | 2.33% |
| 38 | Irvine Tarryholme | 4 | -1 | 0.25% | 0.38% | 2.26% |
Where the % of homes is lower than % of long term empty homes, it indicates areas with above average levels of empty homes.
Sources
Small Area Statistics on Households and Dwellings | National Records of Scotland (nrscotland.gov.uk)
Housing statistics: Empty properties and second homes – gov.scot (www.gov.scot)