
Highland Local Authority
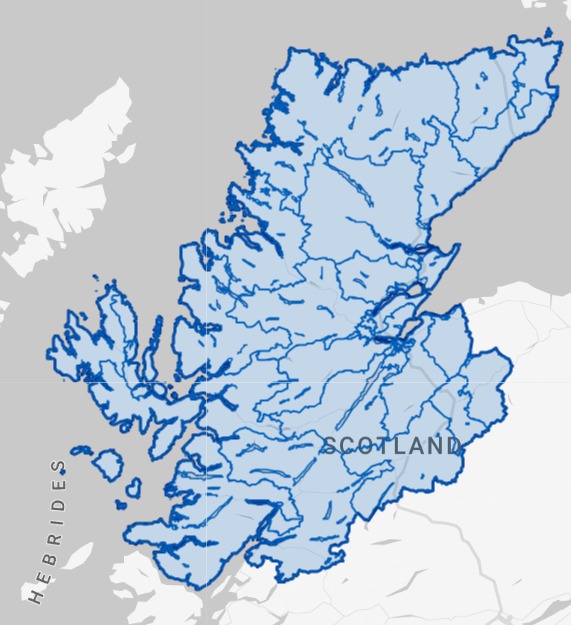
Figures published by National Records of Scotland show that Highland had 3,384 long-term empty homes in 2023. The map and table below shows how these long term empty homes are distributed across the Local Authority area.
• 2.74% of Highland’s homes were long term empty in 2023, compared to 1.70% in Scotland as a whole.
• 98.52% (3,334) of Highland’s long term empty homes have been empty for longer than one year.
• Highland accounts for 11.79% of homes empty for more than 1 year in Scotland.
The EHO for Highland
Dawn Meston ([email protected])
Please click on the map above to go to the Statistics.Gov.UK page for Highland. You can find out the location of each of the Intermediate Data Zones by clicking on 2011 Intermediate Zones under Locations on that page
| Intermediate Data Zones | Number of LTE Homes | Increase or Decrease 2022-2023 | % of Properties LTE | % of Highland LTEs | % of Highland Homes | |
|---|---|---|---|---|---|---|
| 1 | Sutherland South | 138 | -4 | 3.87% | 4.08% | 2.89% |
| 2 | Lochaber West | 135 | +24 | 4.62% | 3.99% | 2.36% |
| 3 | Sutherland North and West | 127 | +7 | 5.64% | 3.75% | 1.82% |
| 4 | Badenoch and Strathspey Central | 125 | +27 | 4.27% | 3.69% | 2.37% |
| 5 | Badenoch and Strathspey South | 101 | +13 | 4.71% | 2.98% | 1.74% |
| 6 | Wick South | 101 | +4 | 5.23% | 2.98% | 1.56% |
| 7 | Ross and Cromarty South West | 95 | +2 | 4.56% | 2.81% | 1.69% |
| 8 | Skye North West | 92 | +3 | 4.63% | 2.72% | 1.61% |
| 9 | Badenoch and Strathspey North | 90 | +25 | 3.55% | 2.66% | 2.05% |
| 10 | Ross and Cromarty North West | 90 | +10 | 4.64% | 2.66% | 1.57% |
| 11 | Lochaber East and North | 89 | +2 | 3.35% | 2.63% | 2.15% |
| 12 | Inverness Muirtown | 84 | +11 | 3.74% | 2.48% | 1.82% |
| 13 | Dingwall | 82 | +15 | 3.03% | 2.42% | 2.19% |
| 14 | Black Isle South | 81 | +10 | 2.41% | 2.39% | 2.72% |
| 15 | Caithness North West | 81 | +19 | 3.20% | 2.39% | 2.05% |
| 16 | Inverness Central, Raigmore and Longman | 79 | +8 | 3.50% | 2.33% | 1.83% |
| 17 | Sutherland East | 77 | +6 | 3.27% | 2.28% | 1.91% |
| 18 | Inverness Crown and Haugh | 76 | +6 | 3.43% | 2.25% | 1.80% |
| 19 | Skye South | 75 | +9 | 3.52% | 2.22% | 1.72% |
| 20 | Inverness West Rural | 73 | +2 | 2.18% | 2.16% | 2.71% |
| 21 | Loch Ness | 71 | -1 | 2.89% | 2.10% | 1.99% |
| 22 | Lochalsh | 69 | +15 | 4.23% | 2.04% | 1.32% |
| 23 | Inverness East Rural | 68 | +2 | 2.42% | 2.01% | 2.27% |
| 24 | Seaboard | 66 | +6 | 2.93% | 1.95% | 1.82% |
| 25 | Ross and Cromarty Central | 62 | +9 | 3.55% | 1.83% | 1.41% |
| 26 | Skye North East | 60 | +4 | 3.04% | 1.77% | 1.60% |
| 27 | Fort William South | 57 | -8 | 1.97% | 1.68% | 2.34% |
| 28 | Caithness North East | 56 | -9 | 2.80% | 1.65% | 1.62% |
| 29 | Thurso West | 55 | -1 | 2.40% | 1.63% | 1.86% |
| 30 | Nairn East | 53 | +3 | 2.63% | 1.57% | 1.63% |
| 31 | Fort William North | 48 | +24 | 2.15% | 1.42% | 1.81% |
| 32 | Invergordon | 47 | +5 | 2.16% | 1.39% | 1.76% |
| 33 | Inverness Ballifeary and Dalneigh | 46 | -6 | 2.07% | 1.36% | 1.80% |
| 34 | Inverness Inshes | 45 | -2 | 1.63% | 1.33% | 2.24% |
| 35 | Tain | 44 | -6 | 2.37% | 1.30% | 1.51% |
| 36 | Black Isle North | 43 | -1 | 2.49% | 1.27% | 1.40% |
| 37 | Nairn Rural | 42 | +4 | 1.75% | 1.24% | 1.94% |
| 38 | Caithness South | 42 | +1 | 2.51% | 1.24% | 1.35% |
| 39 | Alness | 41 | -3 | 1.43% | 1.21% | 2.32% |
| 40 | Thurso East | 41 | -4 | 2.65% | 1.21% | 1.25% |
| 41 | Ross and Cromarty East | 39 | +6 | 2.60% | 1.15% | 1.21% |
| 42 | Inverness Slackbuie | 35 | -4 | 2.02% | 1.03% | 1.40% |
| 43 | Nairn West | 33 | +3 | 1.56% | 0.98% | 1.71% |
| 44 | Inverness Scorguie | 33 | +6 | 2.19% | 0.98% | 1.22% |
| 45 | Inverness Lochardil and Holm Mains | 32 | +6 | 1.03% | 0.95% | 2.50% |
| 46 | Wick North | 32 | -13 | 2.00% | 0.95% | 1.30% |
| 47 | Inverness Westhill | 31 | +2 | 1.01% | 0.92% | 2.48% |
| 48 | Inverness Kinmylies and South West | 31 | 0 | 1.52% | 0.92% | 1.65% |
| 49 | Inverness Drummond | 27 | -1 | 1.65% | 0.80% | 1.32% |
| 50 | Inverness Smithton | 26 | +3 | 1.68% | 0.77% | 1.26% |
| 51 | Inverness Hilton | 26 | -3 | 1.38% | 0.77% | 1.52% |
| 52 | Inverness Merkinch | 26 | -19 | 1.47% | 0.77% | 1.43% |
| 53 | Muir of Ord | 24 | 0 | 1.44% | 0.71% | 1.35% |
| 54 | Conon | 18 | -15 | 0.99% | 0.53% | 1.47% |
| 55 | Inverness Culloden and Balloch | 16 | -6 | 0.86% | 0.47% | 1.50% |
| 56 | Inverness Drakies | 15 | -1 | 1.43% | 0.44% | 0.85% |
Where the % of homes is lower than % of long term empty homes, it indicates areas with above average levels of empty homes.
Sources
Small Area Statistics on Households and Dwellings | National Records of Scotland (nrscotland.gov.uk)
Housing statistics: Empty properties and second homes – gov.scot (www.gov.scot)