
Glasgow City Local Authority
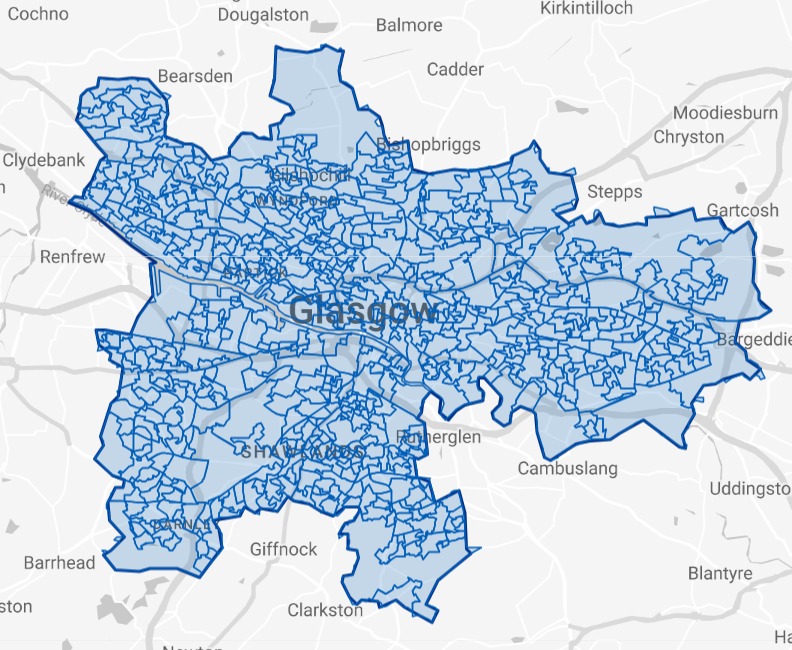
Figures published by National Records of Scotland show that Glasgow City had 2,696 long-term empty homes in 2023. The map and table below shows how these long term empty homes are distributed across the Local Authority area.
• 0.83% of Glasgow City’s homes were long term empty in 2023, compared to 1.70% in Scotland as a whole.
• 51.74% (1,395) of Glasgow City’s long term empty homes have been empty for longer than one year.
• Glasgow City accounts for 4.93% of homes empty for more than 1 year in Scotland.
The EHOs for Glasgow City are
Ann Fay (0141 287 0405)
Anne Robinson (0141 287 7994) [email protected]
Please click on the map above to go to the Statistics.Gov.UK page for Glasgow City. You can find out the location of each of the Intermediate Data Zones by clicking on 2011 Intermediate Zones under Locations on that page
| Intermediate Data Zones | Number of LTE Homes | Increase or Decrease 2022-2023 | % of Properties LTE | % of Glasgow LTEs | % of Glasgow Homes | |
|---|---|---|---|---|---|---|
| 1 | Govanhill West | 127 | -30 | 4.39% | 4.71% | 0.89% |
| 2 | Strathbungo | 80 | -10 | 2.53% | 2.97% | 0.98% |
| 3 | City Centre East | 64 | -7 | 0.88% | 2.37% | 2.24% |
| 4 | Keppochhill | 64 | +15 | 2.37% | 2.37% | 0.83% |
| 5 | Newlands | 62 | -3 | 0.09% | 0.07% | 0.70% |
| 6 | City Centre West | 55 | +3 | 1.63% | 2.04% | 1.04% |
| 7 | Woodlands | 44 | -3 | 1.20% | 1.63% | 1.13% |
| 8 | Gorbals and Hutchesontown | 43 | -4 | 1.26% | 1.59% | 1.05% |
| 9 | Springburn | 42 | +9 | 1.65% | 1.56% | 0.79% |
| 10 | Firhill | 42 | 0 | 1.25% | 1.56% | 1.04% |
| 11 | Laurieston and Tradeston | 39 | -15 | 1.08% | 1.45% | 1.11% |
| 12 | Kelvingrove and University | 38 | -9 | 1.30% | 1.41% | 0.90% |
| 13 | Carntyne West and Haghill | 36 | -19 | 1.29% | 1.34% | 0.86% |
| 14 | Partickhill and Hyndland | 36 | 0 | 1.15% | 1.34% | 0.96% |
| 15 | Gallowgate North and Bellgrove | 35 | -2 | 0.94% | 1.30% | 1.14% |
| 16 | Finnieston and Kelvinhaugh | 35 | +1 | 0.57% | 1.30% | 1.90% |
| 17 | Dennistoun | 33 | +4 | 1.43% | 1.22% | 0.71% |
| 18 | Cathcart | 32 | -8 | 0.94% | 1.19% | 1.05% |
| 19 | City Centre South | 32 | -21 | 1.30% | 1.19% | 0.76% |
| 20 | Dowanhill | 32 | +3 | 1.29% | 1.19% | 0.77% |
| 21 | Possil Park | 31 | -33 | 1.01% | 1.15% | 0.95% |
| 22 | Ibrox East and Cessnock | 30 | +4 | 1.34% | 1.11% | 0.69% |
| 23 | Govanhill East and Aikenhead | 30 | -15 | 1.34% | 1.11% | 0.69% |
| 24 | Pollokshields East | 28 | -5 | 1.29% | 1.04% | 0.67% |
| 25 | Parkhead East and Braidfauld North | 28 | +2 | 1.45% | 1.04% | 0.60% |
| 26 | Springburn East and Cowlairs | 27 | -37 | 1.18% | 1.00% | 0.70% |
| 27 | Woodside | 27 | 0 | 1.15% | 1.00% | 0.72% |
| 28 | Pollokshaws | 26 | +7 | 0.89% | 0.96% | 0.90% |
| 29 | Calton and Gallowgate | 26 | -5 | 0.92% | 0.96% | 0.87% |
| 30 | Anderston | 26 | -10 | 0.93% | 0.96% | 0.86% |
| 31 | Ruchill | 26 | -13 | 0.66% | 0.96% | 1.21% |
| 32 | Baillieston East | 25 | +6 | 0.70% | 0.93% | 1.10% |
| 33 | Tollcross | 25 | +7 | 1.21% | 0.93% | 0.64% |
| 34 | Govan and Linthouse | 24 | -3 | 0.73% | 0.89% | 1.01% |
| 35 | Ibrox | 24 | +8 | 1.31% | 0.89% | 0.56% |
| 36 | Shawlands West | 24 | +4 | 1.06% | 0.89% | 0.70% |
| 37 | Dennistoun North | 24 | -3 | 1.05% | 0.89% | 0.70% |
| 38 | Kelvinside and Jordanhill | 24 | +10 | 0.89% | 0.89% | 0.83% |
| 39 | Nitshill | 23 | +7 | 0.70% | 0.85% | 1.01% |
| 40 | Pollokshields West | 23 | 0 | 1.32% | 0.85% | 0.54% |
| 41 | Bridgeton | 23 | +5 | 1.10% | 0.85% | 0.64% |
| 42 | Braidfauld | 23 | -4 | 0.68% | 0.85% | 1.04% |
| 43 | Maryhill East | 23 | 0 | 1.29% | 0.85% | 0.55% |
| 44 | Kelvindale | 23 | +4 | 0.83% | 0.85% | 0.86% |
| 45 | Broomhill | 23 | +5 | 0.98% | 0.85% | 0.72% |
| 46 | Craigton | 22 | +8 | 1.11% | 0.82% | 0.61% |
| 47 | Battlefield | 21 | -8 | 0.75% | 0.78% | 0.86% |
| 48 | Langside | 21 | -5 | 0.84% | 0.78% | 0.77% |
| 49 | Shettleston North | 21 | -7 | 0.75% | 0.78% | 0.87% |
| 50 | Cowlairs and Port Dundas | 21 | -4 | 1.00% | 0.78% | 0.64% |
| 51 | North Kelvin | 21 | -8 | 1.03% | 0.78% | 0.63% |
| 52 | Glasgow Harbour and Partick South | 21 | 0 | 0.68% | 0.78% | 0.95% |
| 53 | Anniesland West | 21 | -5 | 0.61% | 0.78% | 1.05% |
| 54 | Castlemilk | 20 | -8 | 0.77% | 0.74% | 0.80% |
| 55 | Parkhead West and Barrowfield | 20 | -17 | 0.52% | 0.74% | 1.18% |
| 56 | Cranhill, Lightburn and Queenslie South | 20 | +1 | 0.67% | 0.74% | 0.92% |
| 57 | Hillhead | 20 | -12 | 0.31% | 0.74% | 1.98% |
| 58 | Kinning Park and Festival Park | 19 | -5 | 0.86% | 0.70% | 0.68% |
| 59 | Maxwell Park | 19 | +8 | 0.75% | 0.70% | 0.78% |
| 60 | Kingspark South | 19 | +5 | 1.08% | 0.70% | 0.54% |
| 61 | Blackhill and Barmulloch East | 19 | +9 | 0.89% | 0.70% | 0.66% |
| 62 | Drumchapel South | 19 | +13 | 1.66% | 0.70% | 0.35% |
| 63 | Hillington | 18 | +3 | 1.08% | 0.67% | 0.51% |
| 64 | Mosspark | 18 | +12 | 0.76% | 0.67% | 0.73% |
| 65 | Carnwadric West | 18 | +6 | 0.86% | 0.67% | 0.65% |
| 66 | Old Shettleston and Parkhead North | 18 | -1 | 0.74% | 0.67% | 0.74% |
| 67 | Carntyne | 18 | -3 | 0.96% | 0.67% | 0.58% |
| 68 | Yoker South | 18 | -1 | 0.68% | 0.67% | 0.81% |
| 69 | Blairdardie East | 18 | +1 | 0.63% | 0.67% | 0.88% |
| 70 | Drumoyne and Shieldhall | 17 | -5 | 0.51% | 0.63% | 1.03% |
| 71 | Shawlands East | 17 | -10 | 0.84% | 0.63% | 0.63% |
| 72 | Scotstoun South and West | 17 | -1 | 0.94% | 0.63% | 0.56% |
| 73 | Glenwood South | 16 | +3 | 0.60% | 0.59% | 0.81% |
| 74 | Mount Florida | 16 | -11 | 0.68% | 0.59% | 0.73% |
| 75 | Riddrie and Hogganfield | 16 | +1 | 0.65% | 0.59% | 0.75% |
| 76 | Wyndford | 16 | -98 | 0.64% | 0.59% | 0.77% |
| 77 | Knightswood Park East | 16 | +8 | 0.90% | 0.59% | 0.55% |
| 78 | Muirend and Old Cathcart | 15 | -3 | 0.64% | 0.56% | 0.72% |
| 79 | Carmunnock South | 15 | -8 | 0.83% | 0.56% | 0.55% |
| 80 | Summerston Central and West | 15 | +5 | 0.72% | 0.56% | 0.64% |
| 81 | Knightswood East | 15 | +3 | 0.73% | 0.56% | 0.63% |
| 82 | Cardonald North | 14 | -5 | 0.66% | 0.52% | 0.65% |
| 83 | Dalmarnock | 14 | +1 | 0.60% | 0.52% | 0.72% |
| 84 | Milton East | 14 | +3 | 0.85% | 0.52% | 0.51% |
| 85 | Kingston West and Dumbreck | 13 | -6 | 0.68% | 0.48% | 0.59% |
| 86 | Toryglen and Oatlands | 13 | -3 | 0.35% | 0.48% | 1.13% |
| 87 | Baillieston West | 13 | +2 | 0.73% | 0.48% | 0.55% |
| 88 | Alexandra Parade | 13 | -5 | 0.90% | 0.48% | 0.45% |
| 89 | Scotstoun North and East | 13 | -7 | 0.67% | 0.48% | 0.59% |
| 90 | Carnwadric East | 12 | +3 | 0.74% | 0.45% | 0.50% |
| 91 | Barlanark | 12 | +1 | 0.48% | 0.45% | 0.77% |
| 92 | Roystonhill, Blochairn, and Provanmill | 12 | 0 | 0.41% | 0.45% | 0.91% |
| 93 | Milton West | 12 | +5 | 0.55% | 0.45% | 0.68% |
| 94 | Knightswood Park West | 12 | +2 | 0.66% | 0.45% | 0.56% |
| 95 | Darnley East | 11 | 0 | 0.48% | 0.41% | 0.71% |
| 96 | Crookston North | 11 | +1 | 0.76% | 0.41% | 0.45% |
| 97 | Cardonald West and Central | 11 | -1 | 0.45% | 0.41% | 0.76% |
| 98 | Mount Vernon North and Sandyhills | 11 | -1 | 0.68% | 0.41% | 0.50% |
| 99 | Greenfield | 11 | -3 | 0.42% | 0.41% | 0.80% |
| 100 | Craigend and Ruchazie | 11 | -3 | 0.39% | 0.41% | 0.86% |
| 101 | Whiteinch | 11 | -7 | 0.52% | 0.41% | 0.65% |
| 102 | Pollok North and East | 10 | +3 | 0.38% | 0.37% | 0.80% |
| 103 | Kingspark North | 10 | -1 | 0.56% | 0.37% | 0.55% |
| 104 | Partick | 10 | -10 | 0.40% | 0.37% | 0.77% |
| 105 | Anniesland East | 10 | -6 | 0.41% | 0.37% | 0.75% |
| 106 | Drumchapel North | 10 | +2 | 0.60% | 0.37% | 0.52% |
| 107 | Darnley West | 9 | +3 | 0.48% | 0.33% | 0.58% |
| 108 | Crookston South | 9 | +5 | 0.53% | 0.33% | 0.52% |
| 109 | Pollok South and West | 9 | +1 | 0.37% | 0.33% | 0.75% |
| 110 | Cardonald South and East | 9 | +5 | 0.61% | 0.33% | 0.46% |
| 111 | Shettleston South | 9 | +4 | 0.53% | 0.33% | 0.53% |
| 112 | Garrowhill West | 9 | +1 | 0.52% | 0.33% | 0.53% |
| 113 | Easterhouse East | 9 | -10 | 0.52% | 0.33% | 0.53% |
| 114 | Robroyston and Millerston | 9 | -1 | 0.31% | 0.33% | 0.91% |
| 115 | Summerston North | 9 | -5 | 0.48% | 0.33% | 0.57% |
| 116 | Penilee | 8 | -1 | 0.34% | 0.30% | 0.72% |
| 117 | North Barlanark and Easterhouse South | 8 | +7 | 0.52% | 0.30% | 0.47% |
| 118 | Drumry East | 8 | -7 | 0.51% | 0.30% | 0.48% |
| 119 | Garthamlock, Auchinlea and Gartloch | 7 | +2 | 0.32% | 0.26% | 0.67% |
| 120 | Petershill | 7 | +3 | 0.41% | 0.26% | 0.53% |
| 121 | Blairdardie West | 7 | +5 | 0.57% | 0.26% | 0.38% |
| 122 | Darnley North | 6 | -4 | 0.34% | 0.22% | 0.55% |
| 123 | Carmunnock North | 6 | +1 | 0.47% | 0.22% | 0.39% |
| 124 | Glenwood North | 6 | +1 | 0.28% | 0.22% | 0.65% |
| 125 | Maryhill West | 6 | -5 | 0.38% | 0.22% | 0.49% |
| 126 | Victoria Park | 6 | -2 | 0.51% | 0.22% | 0.36% |
| 127 | Garrowhill East and Swinton | 5 | -2 | 0.28% | 0.19% | 0.54% |
| 128 | Yoker North | 5 | +1 | 0.42% | 0.19% | 0.36% |
| 129 | Merrylee and Millbrae | 4 | -2 | 0.26% | 0.15% | 0.47% |
| 130 | Central Easterhouse | 4 | -4 | 0.32% | 0.15% | 0.38% |
| 131 | Balornock | 4 | -1 | 0.27% | 0.15% | 0.46% |
| 132 | Barmulloch | 4 | +1 | 0.31% | 0.15% | 0.40% |
| 133 | Sighthill | 4 | +2 | 0.92% | 0.15% | 0.13% |
| 134 | Knightswood West | 4 | -4 | 0.30% | 0.15% | 0.41% |
| 135 | Carmyle and Mount Vernon South | 3 | +1 | 0.25% | 0.11% | 0.37% |
| 136 | Drumry West | 1 | -2 | 0.06% | 0.04% | 0.48% |
Where the % of homes is lower than % of long term empty homes, it indicates areas with above average levels of empty homes.
Sources
Small Area Statistics on Households and Dwellings | National Records of Scotland (nrscotland.gov.uk)
Housing statistics: Empty properties and second homes – gov.scot (www.gov.scot)