
East Ayrshire Local Authority
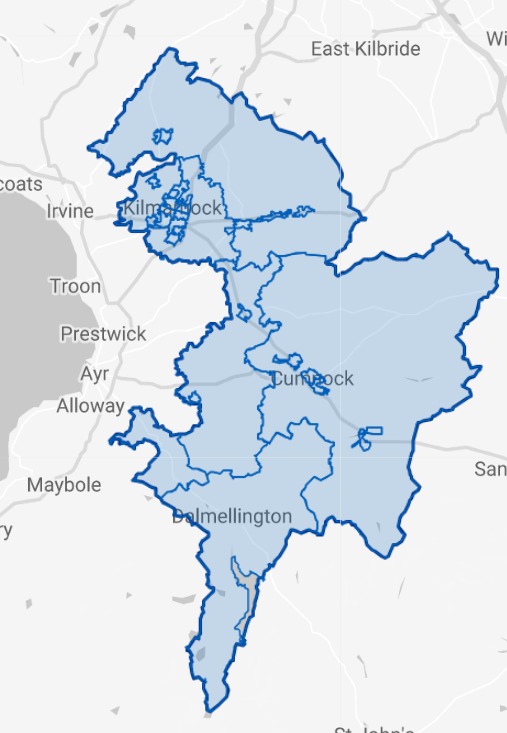
Figures published by National Records of Scotland show that East Ayrshire had 524 long-term empty homes in 2023. The map and table below shows how these long term empty homes are distributed across the Local Authority area.
• 0.88% of East Ayrshire’s homes were long term empty in 2023, compared to 1.70% in Scotland as a whole.
• 70.42% (369) of East Ayrshire’s long term empty homes have been empty for longer than one year.
• East Ayrshire accounts for 1.30% of homes empty for more than 1 year in Scotland.
The EHO for East Ayrshire
Dawn Cadwell (07785446115)
Please click on the map above to go to the Statistics.Gov.UK page for East Ayrshire. You can find out the location of each of the Intermediate Data Zones by clicking on 2011 Intermediate Zones under Locations on that page
| Intermediate Data Zones | Number of Long-term Empty Homes | Increase or decrease 2022-2023 | % of Properties LTE | % of EA LTE Homes | % of EA Homes | |
|---|---|---|---|---|---|---|
| 1 | Mauchline Rural | 50 | -20 | 2.00% | 9.54% | 4.19% |
| 2 | Newmilns | 46 | -3 | 2.89% | 8.78% | 2.67% |
| 3 | Bonnyton and Town Centre | 34 | +1 | 1.45% | 6.49% | 3.93% |
| 4 | Cumnock Rural | 32 | +1 | 1.34% | 6.11% | 4.00% |
| 5 | Darvel | 30 | +3 | 1.59% | 5.73% | 3.17% |
| 6 | Doon Valley South | 25 | -4 | 1.61% | 4.77% | 2.61% |
| 7 | Northern and Irvine Valley Rural | 21 | -1 | 0.77% | 4.01% | 4.58% |
| 8 | Piersland | 20 | 0 | 1.12% | 3.82% | 2.99% |
| 9 | Galston | 20 | +4 | 2.32% | 3.82% | 3.97% |
| 10 | Crosshouse, Gatehead and Kilmaurs Rural | 20 | +4 | 0.84% | 3.82% | 3.98% |
| 11 | Mauchline | 18 | -2 | 0.94% | 3.44% | 3.21% |
| 12 | Altonhil South, Longpark and Hillhead | 18 | -1 | 0.70% | 3.44% | 4.31% |
| 13 | Doon Valley North | 18 | +7 | 0.95% | 3.44% | 3.16% |
| 14 | Grange, and Howard and Gargieston | 17 | +3 | 0.65% | 3.24% | 4.36% |
| 15 | Auchinleck | 17 | +6 | 0.95% | 3.24% | 3.01% |
| 16 | Cumnock South and Craigens | 16 | -1 | 0.69% | 3.05% | 3.87% |
| 17 | Kilmarnock South Central and Caprington | 15 | +3 | 0.91% | 2.86% | 2.76% |
| 18 | Cumnock North | 14 | +1 | 0.73% | 2.67% | 3.21% |
| 19 | Earlston and Hurlford Rural | 13 | -2 | 0.51% | 2.48% | 4.30% |
| 20 | New Cumnock | 13 | +1 | 0.93% | 2.48% | 2.33% |
| 21 | Stewarton East | 10 | -1 | 0.52% | 1.91% | 3.19% |
| 22 | Bellfield and Kirkstyle | 10 | +2 | 0.46% | 1.91% | 3.67% |
| 23 | Southcraig and Beansburn | 8 | 0 | 0.34% | 1.53% | 3.92% |
| 24 | Kilmaurs | 8 | 0 | 0.61% | 1.53% | 2.18% |
| 25 | Shortlees | 6 | -3 | 0.29% | 1.15% | 3.42% |
| 26 | Drongan | 6 | -1 | 0.41% | 1.15% | 2.46% |
| 27 | Altonhil North and Onthank | 6 | 0 | 0.30% | 1.15% | 3.39% |
| 28 | Dean and New Farm Loch North | 6 | +3 | 0.37% | 1.15% | 2.68% |
| 29 | Stewarton West | 4 | -3 | 0.31% | 0.76% | 2.16% |
| 30 | New Farm Loch South | 3 | 0 | 0.22% | 0.57% | 2.33% |
Where the % of homes is lower than % of long term empty homes, it indicates areas with above average levels of empty homes.
Sources
Small Area Statistics on Households and Dwellings | National Records of Scotland (nrscotland.gov.uk)
Housing statistics: Empty properties and second homes – gov.scot (www.gov.scot)