
Dumfries & Galloway Local Authority
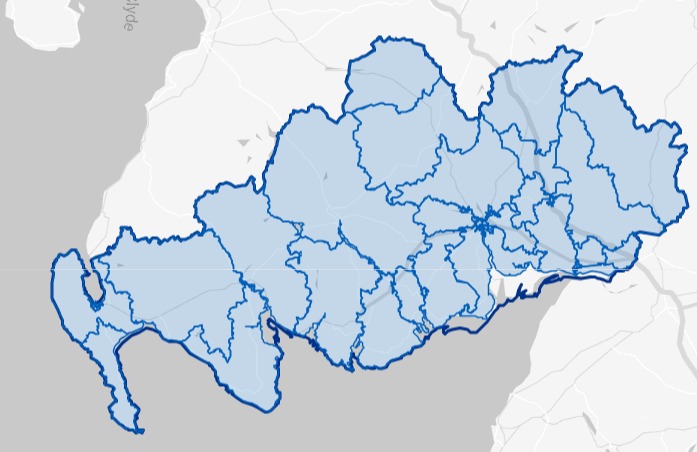
Figures published by National Records of Scotland show that Dumfries & Galloway had 1,844 long-term empty homes in 2023. The map and table below shows how these long term empty homes are distributed across the Local Authority area.
• 2.42% of Dumfries & Galloway’s homes were long term empty in 2023, compared to 1.70% in Scotland as a whole.
• 68.22% (1,258) of Dumfries & Galloway’s long term empty homes have been empty for longer than one year.
• Dumfries & Galloway accounts for 4.45% of homes empty for more than 1 year in Scotland.
The EHO for Dumfries & Galloway:
Gillian Flack (07721 504377)
Please click on the map above to go to the Statistics.Gov.UK page for Dumfries & Galloway. You can find out the location of each of the Intermediate Data Zones by clicking on 2011 Intermediate Zones under Locations on that page
| Intermediate Data Zones | Number of Long-term Empty Homes | Increase or decrease 2022-2023 | % of Properties LTE | % of D&G LTE homes | % of D&G Homes | |
|---|---|---|---|---|---|---|
| 1 | Machars South | 108 | +29 | 3.82% | 5.86% | 3.71% |
| 2 | Dumfries Central | 60 | -10 | 2.81% | 3.25% | 2.80% |
| 3 | Rhins North | 75 | +5 | 3.80% | 4.07% | 2.59% |
| 4 | Glenkens | 81 | +14 | 4.00% | 4.39% | 2.66% |
| 5 | Newton Stewart | 74 | +15 | 2.70% | 4.01% | 3.59% |
| 6 | Langholm and Eskdale | 76 | +17 | 3.85% | 4.12% | 2.59% |
| 7 | Stranraer East | 60 | +3 | 3.94% | 3.25% | 2.00% |
| 8 | Upper Nithsdale | 77 | +21 | 3.33% | 4.18% | 3.03% |
| 9 | Kirkcudbright | 71 | +17 | 2.59% | 3.85% | 3.59% |
| 10 | Thornhill | 74 | +25 | 1.86% | 4.01% | 2.75% |
| 11 | Annandale West | 48 | +5 | 3.61% | 2.60% | 1.74% |
| 12 | Machars North | 42 | 0 | 3.11% | 2.28% | 1.77% |
| 13 | Gatehouse | 50 | +9 | 2.68% | 2.71% | 2.44% |
| 14 | Dalbeattie Rural | 45 | +5 | 3.21% | 2.44% | 1.84% |
| 15 | Annandale East | 63 | +24 | 3.40% | 3.42% | 2.43% |
| 16 | Moffat | 51 | +13 | 2.52% | 2.77% | 2.65% |
| 17 | Annan West | 52 | +15 | 2.93% | 2.82% | 2.33% |
| 18 | Castle Douglas | 48 | +12 | 2.01% | 2.60% | 3.13% |
| 19 | Mid Nithsdale | 57 | +21 | 2.76% | 3.09% | 2.71% |
| 20 | Lockerbie | 48 | +13 | 1.90% | 2.60% | 3.31% |
| 21 | Nunholm | 42 | +12 | 2.40% | 2.28% | 2.30% |
| 22 | Stranraer West | 37 | +5 | 1.87% | 2.01% | 2.59% |
| 23 | New Abbey | 25 | 0 | 1.51% | 1.36% | 2.18% |
| 24 | Rhins South | 37 | +12 | 3.22% | 2.01% | 1.51% |
| 25 | Lochside and Lincluden | 28 | +4 | 1.01% | 1.52% | 3.63% |
| 26 | Annan East | 37 | +13 | 2.59% | 2.01% | 3.39% |
| 27 | Kingholm | 24 | 0 | 1.51% | 1.30% | 2.08% |
| 28 | Gretna | 32 | +9 | 1.58% | 1.74% | 2.66% |
| 29 | Eastriggs | 24 | +4 | 1.67% | 1.30% | 1.89% |
| 30 | Shawhead | 25 | +6 | 1.66% | 1.36% | 1.98% |
| 31 | Lochmaben | 28 | +10 | 1.75% | 1.52% | 2.09% |
| 32 | Dalbeattie | 25 | +8 | 1.14% | 1.36% | 2.88% |
| 33 | Collin | 21 | +8 | 1.06% | 1.14% | 2.59% |
| 34 | Troqueer | 32 | +19 | 1.81% | 1.74% | 2.32% |
| 35 | Stranraer South | 10 | 0 | 0.63% | 0.54% | 2.08% |
| 36 | Georgetown | 10 | 0 | 0.76% | 0.54% | 1.73% |
| 37 | Locharbriggs | 17 | +8 | 1.15% | 0.92% | 1.94% |
| 38 | Calside | 12 | +3 | 0.93% | 0.65% | 1.69% |
| 39 | Summerville | 7 | 0 | 0.30% | 0.38% | 3.09% |
| 40 | Heathhall | 7 | +1 | 0.53% | 0.38% | 1.74% |
Where the % of homes is lower than % of long term empty homes, it indicates areas with above average levels of empty homes.
Sources
Small Area Statistics on Households and Dwellings | National Records of Scotland (nrscotland.gov.uk)
Housing statistics: Empty properties and second homes – gov.scot (www.gov.scot)