
City of Edinburgh Local Authority
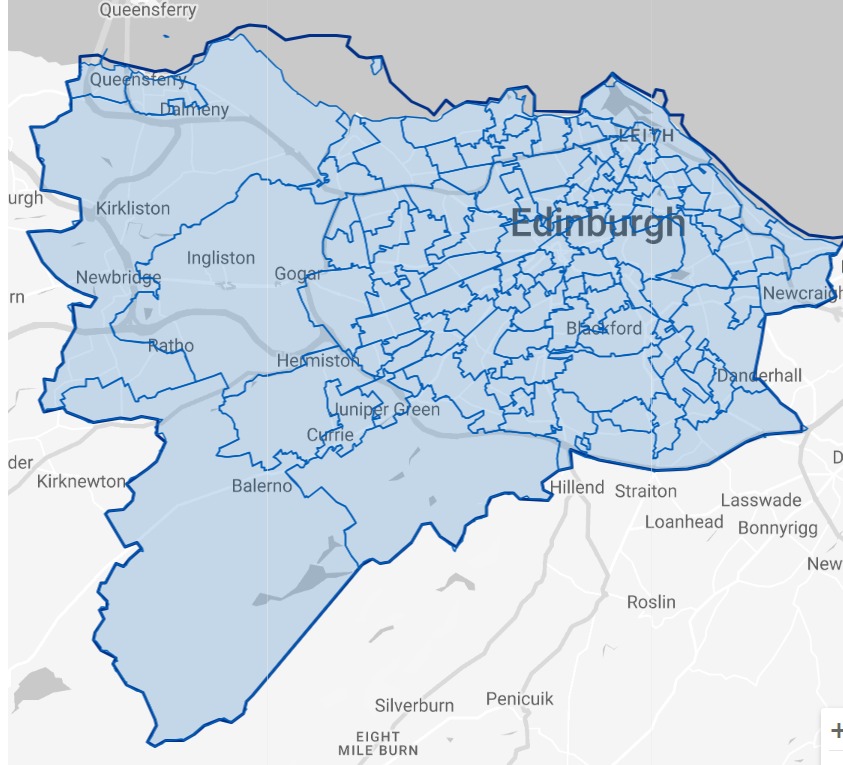
Figures published by National Records of Scotland show that City of Edinburgh had 7,202 long-term empty homes in 2023. The map and table below shows how these long term empty homes are distributed across the Local Authority area.
• 2.73% of City of Edinburgh’s homes were long term empty in 2023, compared to 1.70% in Scotland as a whole.
• 38.20% (2,751) of City of Edinburgh’s long term empty homes have been empty for longer than one year.
• City of Edinburgh accounts for 9.73% of homes empty for more than 1 year in Scotland.
The EHO for City of Edinburgh:
John Addison (07590 211082)
Please click on the map above to go to the Statistics.Gov.UK page for City of Edinburgh. You can find out the location of each of the Intermediate Data Zones by clicking on 2011 Intermediate Zones under Locations on that page
| Intermediate Data Zones | Number of LTE Homes | Increase or decrease 2022-2023 | % of Properties LTE | % of Edinburgh LTE | % of Edinburgh homes | |
|---|---|---|---|---|---|---|
| 1 | Dalry and Fountainbridge | 238 | +72 | 4.39% | 3.30% | 2.06% |
| 2 | Old town, Princes Street and Leith Street | 223 | +9 | 6.31% | 3.10% | 1.34% |
| 3 | Meadows and Southside | 204 | +13 | 5.30% | 2.83% | 1.46% |
| 4 | Tollcross | 181 | -29 | 4.72% | 2.51% | 1.45% |
| 5 | Deans Village | 173 | +7 | 4.17% | 2.40% | 1.57% |
| 6 | Canongate, Southside and Dumbiedykes | 164 | -4 | 4.23% | 2.28% | 1.47% |
| 7 | Stockbridge | 155 | -7 | 4.36% | 2.15% | 1.35% |
| 8 | Restalrig and Lochend | 153 | +38 | 6.19% | 2.12% | 0.94% |
| 9 | Hillside and Carlton Hill | 136 | -13 | 3.87% | 1.89% | 1.33% |
| 10 | Gorgie West | 132 | +19 | 3.83% | 1.83% | 1.31% |
| 11 | Slateford and Chesser | 122 | +40 | 4.02% | 1.69% | 1.15% |
| 12 | Marchmont East and Sciennes | 115 | -4 | 4.83% | 1.60% | 0.90% |
| 13 | Great Junction Street | 111 | -14 | 3.61% | 1.54% | 1.17% |
| 14 | New Town West | 110 | -13 | 4.82% | 1.53% | 0.87% |
| 15 | The Shore and Constitution Street | 110 | +18 | 3.30% | 1.53% | 1.26% |
| 16 | Bruntsfield | 109 | -4 | 3.85% | 1.51% | 1.07% |
| 17 | Muirhouse | 107 | +7 | 3.43% | 1.49% | 1.19% |
| 18 | North Leith and Newhaven | 107 | +16 | 3.50% | 1.49% | 1.16% |
| 19 | South Leith | 106 | +27 | 3.35% | 1.47% | 1.20% |
| 20 | Canonmills and New Town North | 103 | +7 | 5.40% | 1.43% | 0.72% |
| 21 | Stenhouse and Saughton Mains | 102 | +13 | 3.01% | 1.42% | 1.28% |
| 22 | Polwarth | 95 | -15 | 3.60% | 1.32% | 1.00% |
| 23 | Easter Road and Hawkhill Avenue | 95 | +2 | 4.12% | 1.32% | 0.87% |
| 24 | Gorgie East | 92 | -29 | 3.77% | 1.28% | 0.92% |
| 25 | Bingham, Magdalene and The Christians | 92 | +20 | 4.80% | 1.28% | 0.73% |
| 26 | Leith (Albert Street) | 88 | +7 | 4.42% | 1.22% | 0.75% |
| 27 | Newington and Dalkeith Road | 87 | -3 | 4.01% | 1.21% | 0.82% |
| 28 | Craigmillar | 86 | +10 | 2.24% | 1.19% | 1.45% |
| 29 | Meadowbank and Abbeyhill North | 85 | -11 | 2.54% | 1.18% | 1.27% |
| 30 | Morningside | 84 | +15 | 3.15% | 1.17% | 1.01% |
| 31 | Broughton North and Powderhall | 80 | -31 | 2.59% | 1.11% | 1.17% |
| 32 | Shandon | 78 | +1 | 2.88% | 1.08% | 1.03% |
| 33 | The Grange | 75 | +1 | 2.79% | 1.04% | 1.02% |
| 34 | Murrayburn and Wester Hailes North | 75 | +3 | 3.67% | 1.04% | 0.77% |
| 35 | Broughton South | 75 | +19 | 2.73% | 1.04% | 1.04% |
| 36 | Restalrig (Loganlea) and Craigentinny West | 74 | -3 | 3.49% | 1.03% | 0.80% |
| 37 | The Calders | 72 | +2 | 3.14% | 1.00% | 0.87% |
| 38 | West Pilton | 72 | +3 | 2.80% | 1.00% | 0.98% |
| 39 | Clermiston and Drumbrae | 72 | +19 | 2.45% | 1.00% | 1.12% |
| 40 | Marchmont West | 71 | -25 | 3.73% | 0.99% | 0.72% |
| 41 | Pilrig | 70 | -9 | 3.77% | 0.97% | 0.70% |
| 42 | New Town East and Gayfield | 69 | -5 | 4.00% | 0.96% | 0.65% |
| 43 | Niddrie | 69 | +7 | 2.86% | 0.96% | 0.92% |
| 44 | Gracemount, Southhouse and Burdiehouse | 69 | +16 | 3.43% | 0.89% | 0.71% |
| 45 | The Inch | 68 | +19 | 2.79% | 0.94% | 0.93% |
| 46 | Granton and Royston Mains | 64 | -9 | 2.52% | 0.89% | 0.96% |
| 47 | Northfield and Piershill | 64 | -2 | 3.43% | 0.89% | 0.71% |
| 48 | Portobello | 62 | 0 | 2.30% | 0.86% | 1.02% |
| 49 | Western Harbour and Leith Docks | 61 | +2 | 1.74% | 0.85% | 1.33% |
| 50 | Blackford, West Mains and Mayfield Road | 61 | +2 | 2.04% | 0.85% | 1.13% |
| 51 | Comely Bank | 60 | -13 | 3.21% | 0.83% | 0.71% |
| 52 | Willowbrae and Duddingston Village | 60 | -6 | 2.30% | 0.83% | 0.99% |
| 53 | Balgreen and Roseburn | 60 | +13 | 2.65% | 0.83% | 0.86% |
| 54 | Morningside and Craighouse | 59 | +10 | 2.56% | 0.82% | 0.88% |
| 55 | Abbeyhill | 58 | -6 | 3.20% | 0.81% | 0.69% |
| 56 | Granton South and Wardieburn | 54 | +8 | 3.47% | 0.75% | 0.59% |
| 57 | Dalmeny, Kirkliston and Newbridge | 54 | +11 | 1.42% | 0.75% | 1.44% |
| 58 | Merchiston and Greenhill | 51 | -8 | 2.11% | 0.71% | 0.92% |
| 59 | Prestonfield | 50 | -5 | 2.84% | 0.69% | 0.67% |
| 60 | Inverleith, Goldenacre and Warriston | 50 | -1 | 2.61% | 0.69% | 0.73% |
| 61 | Corstorphine | 50 | +9 | 1.94% | 0.69% | 0.98% |
| 62 | Ratho, Ingliston and Gogar | 47 | -1 | 2.26% | 0.65% | 0.79% |
| 63 | Bonnington | 45 | -12 | 1.86% | 0.62% | 0.92% |
| 64 | Craigleith, Orchard Brae and Crewe Toll | 44 | -3 | 1.85% | 0.61% | 0.90% |
| 65 | Clovenstone and Wester Hailes | 42 | -10 | 2.75% | 0.58% | 0.58% |
| 66 | Drylaw | 42 | +9 | 1.92% | 0.58% | 0.83% |
| 67 | Moredun and Craigour | 41 | +10 | 2.68% | 0.57% | 0.58% |
| 68 | Joppa | 40 | +6 | 1.71% | 0.56% | 0.89% |
| 69 | South Gyle | 40 | +9 | 1.68% | 0.56% | 0.90% |
| 70 | Broomhouse and Bankhead | 39 | +3 | 2.18% | 0.54% | 0.68% |
| 71 | Trinity | 38 | -10 | 1.70% | 0.53% | 0.85% |
| 72 | Leith (Hermitage and Prospect Bank) | 37 | +4 | 1.70% | 0.51% | 0.83% |
| 73 | Balerno and Bonnington Village | 37 | +7 | 1.44% | 0.51% | 0.98% |
| 74 | Queensferry East | 36 | +11 | 1.55% | 0.50% | 0.88% |
| 75 | Blackhall | 35 | -2 | 1.40% | 0.49% | 0.95% |
| 76 | Craiglockhart | 35 | +9 | 1.62% | 0.49% | 0.82% |
| 77 | Colinton Mains and Firrhill | 34 | +3 | 1.70% | 0.47% | 0.76% |
| 78 | Longstone and Saughton | 33 | +1 | 1.64% | 0.46% | 0.77% |
| 79 | Bosswall and Pilton | 32 | -12 | 1.22% | 0.44% | 0.99% |
| 80 | Hyvots and Gilmerton | 32 | +9 | 1.79% | 0.44% | 0.68% |
| 81 | Silverknowes and Davidson’s Mains | 31 | +2 | 1.65% | 0.43% | 0.71% |
| 82 | Barnton, Cameo and Cramond South | 30 | -1 | 1.69% | 0.42% | 0.67% |
| 83 | Fernieside and Moredun South | 30 | +7 | 1.57% | 0.42% | 0.72% |
| 84 | Murrayfield and Ravelston | 30 | +8 | 1.57% | 0.42% | 0.72% |
| 85 | Mountcastle | 29 | +3 | 2.49% | 0.40% | 0.44% |
| 86 | East Craigs North | 28 | +2 | 1.37% | 0.39% | 0.78% |
| 87 | Trinity East and The Dudleys | 28 | +2 | 1.65% | 0.39% | 0.64% |
| 88 | Oxgangs | 27 | -4 | 1.85% | 0.37% | 0.56% |
| 89 | Jewel, Brunstane and Newcraighall | 27 | +11 | 1.22% | 0.37% | 0.84% |
| 90 | Granton West and Salvensen | 26 | -1 | 1.39% | 0.36% | 0.71% |
| 91 | Gilmerton South and the Murrays | 26 | +2 | 0.71% | 0.36% | 1.39% |
| 92 | Baberton and Juniper Green | 26 | +6 | 1.36% | 0.36% | 0.73% |
| 93 | Currie West | 26 | +13 | 1.45% | 0.36% | 0.68% |
| 94 | Comiston and Swanston | 24 | +1 | 1.04% | 0.33% | 0.87% |
| 95 | East Craigs South | 24 | +7 | 1.07% | 0.33% | 0.85% |
| 96 | Corstophine South | 23 | 0 | 1.05% | 0.32% | 0.83% |
| 97 | Cramond | 23 | +5 | 2.02% | 0.32% | 0.43% |
| 98 | Queensferry West | 23 | +1 | 1.39% | 0.32% | 0.63% |
| 99 | Greenbank and The Braids | 21 | +2 | 1.16% | 0.29% | 0.69% |
| 100 | Corstorphine North | 20 | +2 | 1.24% | 0.28% | 0.61% |
| 101 | Liberton East | 20 | +12 | 1.55% | 0.28% | 0.49% |
| 102 | Liberton West and Braid Hills | 19 | +1 | 1.11% | 0.26% | 0.65% |
| 103 | Bonaly and the Pentlands | 18 | -3 | 0.94% | 0.25% | 0.73% |
| 104 | Mortonhall and Anwickhill | 18 | +4 | 1.44% | 0.25% | 0.47% |
| 105 | Currie East | 17 | +1 | 1.15% | 0.24% | 0.56% |
| 106 | Colinton and Kingsknowe | 16 | -2 | 0.95% | 0.22% | 0.64% |
| 107 | Carrick Knowe | 16 | -2 | 1.34% | 0.22% | 0.45% |
| 108 | Duddingston and Portobello South | 16 | -1 | 0.95% | 0.22% | 0.64% |
| 109 | Craigentinny | 15 | +3 | 1.20% | 0.21% | 0.47% |
| 110 | Parkhead and Sighthill | 13 | -13 | 0.90% | 0.18% | 0.55% |
| 111 | Fairmilehead | 11 | -3 | 0.52% | 0.15% | 0.80% |
Where the % of homes is lower than % of long term empty homes, it indicates areas with above average levels of empty homes.
Sources
Small Area Statistics on Households and Dwellings | National Records of Scotland (nrscotland.gov.uk)
Housing statistics: Empty properties and second homes – gov.scot (www.gov.scot)