
Aberdeenshire Local Authority
Please note, this report uses the definition of “long term empty” (LTE) used by National Records Scotland (NRS): “homes empty for 6+ months (and liable for council tax).” Figures published by NRS show that Aberdeenshire had 2,989* LTE homes in 2024. The table below shows how these LTE homes are distributed across the Local Authority area.
• 2.43% of Aberdeenshire’s homes were LTE in 2024, compared to 1.80% in Scotland as a whole.
• 75.80% (2,218) of Aberdeenshire’s empty homes have been empty for longer than one year**.
• Aberdeenshire accounts for 7.02% of homes empty for more than 1 year in Scotland.
Empty homes contact for Aberdeenshire:
Moira Simpson (Development Officer, Affordable Housing)
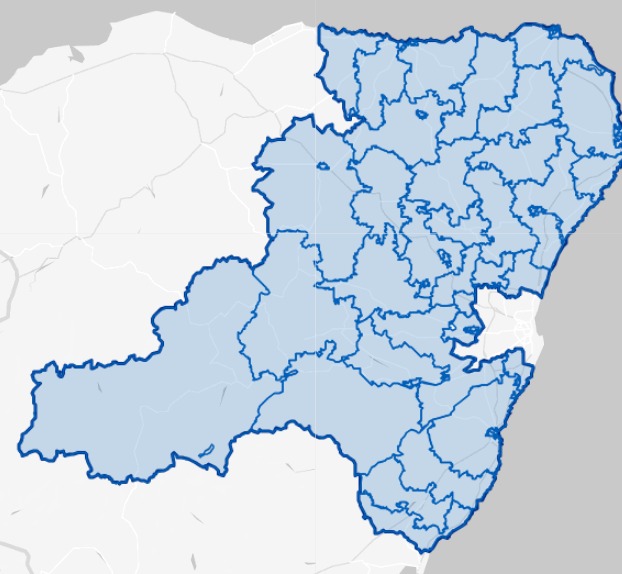
Please click on the map above to go to the Statistics.Gov.UK page for Aberdeenshire. You can find out the location of each of the Intermediate Data Zones by clicking on 2011 Intermediate Zones under Locations on that page
| Intermediate Zones | # of LTE homes | Change 2023-2024 | % Property LTE homes | % of Aberdeenshire's LTE | % of Aberdeenshire's homes | |
|---|---|---|---|---|---|---|
| 1 | Peterhead Harbour | 218 | +24 | 6.38% | 7.29% | 2.77% |
| 2 | East Cairngorms | 116 | +28 | 5.91% | 3.88% | 1.59% |
| 3 | Fraserburgh Harbour and Broadsea | 114 | +8 | 6.27% | 3.81% | 1.48% |
| 4 | Rosehearty and Strathbeg | 95 | +12 | 2.99% | 3.18% | 2.58% |
| 5 | Gardenstown and King Edward | 81 | +3 | 4.97% | 2.71% | 1.32% |
| 6 | Clashindarroch | 74 | +2 | 3.50% | 2.48% | 1.72% |
| 7 | Aberchirder and Whitehills | 72 | +14 | 3.39% | 2.41% | 1.72% |
| 8 | Inverurie South | 68 | +6 | 2.38% | 2.28% | 2.32% |
| 9 | Dunecht, Durris and Drumoak | 66 | +14 | 2.97% | 2.21% | 1.80% |
| 10 | Ythanside | 66 | +11 | 3.06% | 2.21% | 1.75% |
| 11 | Huntly | 66 | +4 | 2.89% | 2.21% | 1.86% |
| 12 | Banff | 66 | +15 | 3.14% | 2.21% | 1.71% |
| 13 | Longside and Rattray | 66 | +9 | 1.89% | 2.21% | 2.84% |
| 14 | Cromar and Kildrummy | 65 | 0 | 3.27% | 2.17% | 1.61% |
| 15 | Cruden | 65 | +11 | 2.84% | 2.17% | 1.86% |
| 16 | Stonehaven South | 61 | +5 | 2.47% | 2.04% | 2.00% |
| 17 | Howe of Alford | 61 | +1 | 1.97% | 2.04% | 2.51% |
| 18 | Ythsie | 61 | +4 | 2.16% | 2.04% | 2.29% |
| 19 | Deer and Mormond | 61 | +11 | 2.57% | 2.04% | 1.93% |
| 20 | Macduff | 59 | -8 | 3.01% | 1.97% | 1.59% |
| 21 | Crathes and Torphins | 58 | +11 | 2.74% | 1.94% | 1.72% |
| 22 | Turriff | 56 | +2 | 2.38% | 1.87% | 1.91% |
| 23 | Insch, Oyne and Ythanwells | 55 | +10 | 2.48% | 1.84% | 1.80% |
| 24 | New Pitsligo | 54 | +16 | 3.69% | 1.81% | 1.19% |
| 25 | Fetteresso, Netherley and Catter | 52 | +3 | 2.04% | 1.74% | 2.07% |
| 26 | Portsoy, Fordyce and Cornhill | 52 | -3 | 3.06% | 1.74% | 1.38% |
| 27 | Ellon East | 49 | +8 | 1.74% | 1.64% | 2.28% |
| 28 | Stonehaven North | 48 | -8 | 1.86% | 1.61% | 2.10% |
| 29 | Inverurie North | 48 | +3 | 1.81% | 1.61% | 2.15% |
| 30 | Durno-Chapel of Garioch | 47 | +9 | 1.39% | 1.57% | 2.75% |
| 31 | Balmedie and Potterton | 47 | +9 | 2.16% | 1.57% | 1.76% |
| 32 | Mearns and Laurencekirk | 45 | +5 | 2.16% | 1.51% | 1.69% |
| 33 | Aboyne and South Deeside | 44 | -10 | 1.83% | 1.47% | 1.95% |
| 34 | Mearns North and Inverbervie | 43 | -7 | 1.72% | 1.44% | 2.03% |
| 35 | Fraserburgh Central-Academy | 42 | -9 | 3.12% | 1.41% | 1.09% |
| 36 | Mearns South and Benholm | 41 | +4 | 2.03% | 1.37% | 1.64% |
| 37 | Peterhead Ugieside | 39 | +8 | 2.06% | 1.30% | 1.54% |
| 38 | Fyvie-Rothie | 38 | +1 | 2.20% | 1.27% | 1.40% |
| 39 | Auchnagatt | 38 | +3 | 2.53% | 1.27% | 1.22% |
| 40 | Banchory-Devenick and Findon | 37 | -1 | 1.65% | 1.24% | 1.82% |
| 41 | Auchterless and Monquhitter | 37 | +5 | 3.06% | 1.24% | 0.98% |
| 42 | Banchory West | 35 | +4 | 2.47% | 1.17% | 1.15% |
| 43 | Westhill North and South | 32 | +2 | 1.67% | 1.07% | 1.56% |
| 44 | Barrahill | 32 | +8 | 1.47% | 1.07% | 1.77% |
| 45 | Fraserburgh Smiddyhill | 31 | +4 | 1.89% | 1.04% | 1.33% |
| 46 | Newmachar and Fintray | 29 | -1 | 1.59% | 0.97% | 1.48% |
| 47 | Peterhead Bay | 29 | -2 | 2.14% | 0.97% | 1.10% |
| 48 | Fraserburgh Lochpots | 28 | +2 | 2.44% | 0.94% | 0.93% |
| 49 | Peterhead Links | 27 | -5 | 1.46% | 0.90% | 1.51% |
| 50 | Kintore | 26 | +3 | 1.10% | 0.87% | 1.92% |
| 51 | Ellon West | 26 | +10 | 1.37% | 0.87% | 1.55% |
| 52 | Banchory East | 20 | -1 | 1.08% | 0.67% | 1.50% |
| 53 | Portlethen | 19 | +5 | 1.04% | 0.64% | 1.49% |
| 54 | Westhill Central | 18 | -3 | 1.00% | 0.60% | 1.46% |
| 55 | Mintlaw | 15 | -1 | 1.20% | 0.50% | 1.02% |
| 56 | Kemnay | 14 | -2 | 0.90% | 0.47% | 1.26% |
| 57 | Blackburn | 14 | -4 | 1.08% | 0.47% | 1.05% |
| 58 | Newtonhill | 12 | -2 | 0.99% | 0.40% | 0.98% |
| 59 | Garlogie and Elrick | 11 | -8 | 0.74% | 0.37% | 1.21% |
Where the % of homes is lower than % of LTE homes, it indicates areas with above average levels of empty homes.
For a full version of this report please contact the partnership’s data analyst at [email protected]
*This differs from the 6+ month empty figure published by Scottish Gov for Aberdeenshire- 2,926
**According to data published by SG
Sources