
Aberdeen City Local Authority
Figures published by National Records of Scotland show that Aberdeen City had 5,785 long-term empty homes in 2022. The map and table below shows how these long term empty homes are distributed across the Local Authority area.
• 4.69% of Aberdeen City’s homes were long term empty in 2022, compared to 1.65% in Scotland as a whole.
• 58.18% (2,344) of Aberdeen City long term empty homes have been empty for longer than one year.
• Aberdeen City accounts for 8.46% of homes empty for more than 1 year in Scotland.
The EHOs for Aberdeen City:
Alison Black (01224045140)
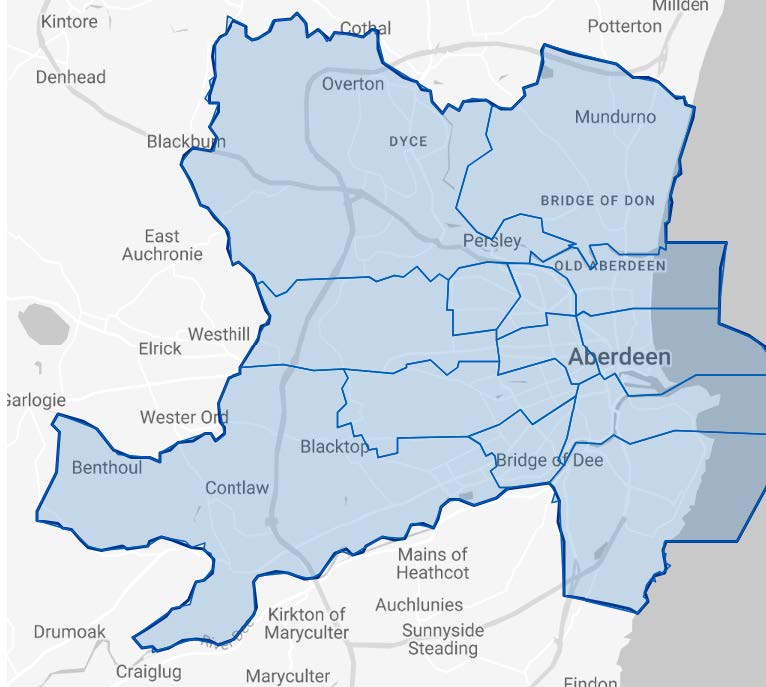
Please click on the map above to go to the Statistics.Gov.UK page for Aberdeen City. You can find out the location of each of the Intermediate Data Zones by clicking on 2011 Intermediate Zones under Locations on that page
| Intermediate Data Zones | Number of LTE Homes | % of Properties LTE | % of Aberdeen City LTE homes | % of Aberdeen City Homes |
|---|---|---|---|---|
| City Centre West | 463 | 13.50% | 8.00% | 2.78% |
| George Street | 389 | 7.74% | 6.72% | 4.07% |
| Seaton | 306 | 9.01% | 5.29% | 2.75% |
| Rosemount | 300 | 7.97% | 5.20% | 3.06% |
| Torry West | 248 | 7.36% | 4.29% | 2.73% |
| Froghall, Powis and Sunnybank | 245 | 7.89% | 4.24% | 2.52% |
| Hanover North | 228 | 8.93% | 3.94% | 2.07% |
| West End South | 221 | 6.10% | 3.82% | 2.94% |
| Ferryhill North | 215 | 7.06% | 3.72% | 2.47% |
| Hanover South | 181 | 7.99% | 3.13% | 1.84% |
| Tillydrone | 176 | 5.82% | 3.04% | 2.45% |
| Hilton | 173 | 5.08% | 2.99% | 2.76% |
| Garthdee | 168 | 5.89% | 2.90% | 2.31% |
| City Centre East | 168 | 8.98% | 2.90% | 1.52% |
| Woodside | 168 | 7.16% | 2.90% | 1.90% |
| Braeside, Mannofield, Broomhill and Seafield East | 150 | 6.28% | 2.59% | 1.94% |
| Stockethill | 148 | 5.12% | 2.56% | 2.34% |
| Torry East | 130 | 5.46% | 2.25% | 1.93% |
| Ashgrove | 128 | 5.56% | 2.21% | 1.87% |
| Old Aberdeen | 122 | 6.22% | 2.11% | 1.59% |
| Ferryhill South | 111 | 4.15% | 1.92% | 2.17% |
| Midstocket | 95 | 3.92% | 1.64% | 1.96% |
| West End North | 89 | 5.25% | 1.54% | 1.37% |
| Bucksburn South | 79 | 2.84% | 1.37% | 2.26% |
| Braeside, Mannofield, Broomhill and Seafield North | 78 | 3.18% | 1.35% | 1.99% |
| Bucksburn North | 70 | 2.25% | 1.21% | 2.52% |
| Hazlehead | 70 | 2.33% | 1.21% | 2.43% |
| Summerhill | 59 | 3.02% | 1.02% | 1.59% |
| Kincorth, Leggart and Nigg South | 57 | 2.20% | 0.99% | 2.10% |
| Heathryfold and Middlefield | 56 | 2.56% | 0.97% | 1.77% |
| Kincorth, Leggart and Nigg North | 56 | 2.87% | 0.97% | 1.58% |
| Cults, Bieldside and Milltimber East | 54 | 2.02% | 0.93% | 2.17% |
| Dyce | 54 | 2.15% | 0.93% | 2.03% |
| Mastrick | 54 | 2.32% | 0.93% | 1.89% |
| Culter | 47 | 1.98% | 0.81% | 1.93% |
| Kingswell | 42 | 1.51% | 0.73% | 2.26% |
| Northfield | 42 | 1.86% | 0.73% | 1.83% |
| Danestone | 41 | 2.27% | 0.71% | 1.46% |
| Sheddocksley | 40 | 1.65% | 0.69% | 1.97% |
| Oldmachar West | 37 | 1.60% | 0.64% | 1.87% |
| Braeside, Mannofield, Broomhill and Seafield South | 33 | 1.79% | 0.57% | 1.50% |
| Cults, Bieldside and Milltimber West | 30 | 1.36% | 0.52% | 1.79% |
| Balgownie and Donmouth West | 28 | 1.55% | 0.48% | 1.46% |
| Cove North | 27 | 1.45% | 0.47% | 1.51% |
| Denmore | 27 | 1.49% | 0.47% | 1.49% |
| Balgownie and Donmouth East | 26 | 2.03% | 0.45% | 1.04% |
| Cummings park | 19 | 1.26% | 0.33% | 1.23% |
| Oldmachar East | 18 | 0.91% | 0.31% | 1.61% |
| Cove South | 18 | 1.04% | 0.31% | 1.40% |
Where the % of housing stock is lower than % of long term empty homes, it indicated areas with above average levels of empty homes.
Sources
Small Area Statistics on Households and Dwellings | National Records of Scotland (nrscotland.gov.uk)