
North Lanarkshire Local Authority
Please note, this report uses the definition of “long term empty” (LTE) used by National Records Scotland (NRS): “homes empty for 6+ months (and liable for council tax).” Figures published by NRS show that North Lanarkshire had 2,060* LTE homes in 2024. The table below shows how these LTE homes are distributed across the Local Authority area.
• 1.28% of North Lanarkshire’s homes were long term empty in 2024, compared to 1.80% in Scotland as a whole.
• 80.52% (2,121) of North Lanarkshire’s empty homes have been empty for longer than one year**.
• North Lanarkshire accounts for 6.71% of homes empty for more than 1 year in Scotland.
North Lanarkshire’s Empty Homes Officer
Alyson McGlone
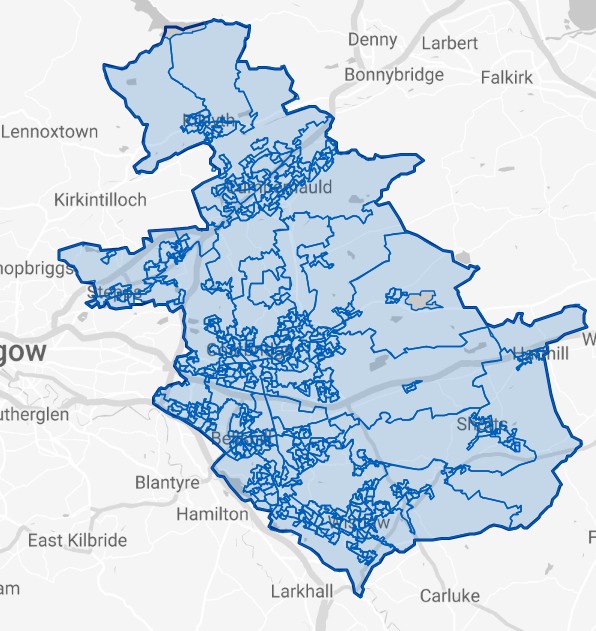
Please click on the map above to go to the Statistics.Gov.UK page for North Lanarkshire. You can find out the location of each of the Intermediate Data Zones by clicking on 2011 Intermediate Zones under Locations on that page
| Intermediate Data Zones | # of LTE Homes | Change 2023-2024 | % of Properties LTE | % of NL LTEs | % of NL Homes | |
|---|---|---|---|---|---|---|
| 1 | Cumbernauld Central | 60 | +6 | 2.46% | 2.91% | 1.51% |
| 2 | Cliftonville | 57 | +36 | 3.87% | 2.77% | 0.91% |
| 3 | Wishaw North | 54 | -1 | 1.74% | 2.62% | 1.93% |
| 4 | Dundyvan | 51 | +9 | 1.77% | 2.48% | 1.79% |
| 5 | Caldercruix and Plains | 48 | +12 | 1.85% | 2.33% | 1.61% |
| 6 | Forgewood | 47 | -7 | 1.93% | 2.28% | 1.51% |
| 7 | Kilsyth East and Croy | 47 | +12 | 1.18% | 2.28% | 2.47% |
| 8 | Harthill and Salsburgh | 44 | +11 | 1.23% | 2.14% | 2.22% |
| 9 | Bellshill South | 44 | +4 | 1.85% | 2.14% | 1.48% |
| 10 | Kildrum | 42 | +1 | 1.91% | 2.04% | 1.37% |
| 11 | Motherwell South | 41 | +21 | 1.71% | 1.99% | 1.49% |
| 12 | Airdrie North | 41 | 0 | 1.61% | 1.99% | 1.58% |
| 13 | Village and Castlecary | 41 | +13 | 2.32% | 1.99% | 1.10% |
| 14 | Newmains | 40 | -2 | 1.58% | 1.94% | 1.57% |
| 15 | Cairnhill | 40 | +15 | 1.87% | 1.94% | 1.33% |
| 16 | Wishaw South | 38 | +9 | 1.54% | 1.84% | 1.54% |
| 17 | Coatdyke and Whinhall | 37 | -3 | 1.39% | 1.80% | 1.66% |
| 18 | Gartcosh and Marnock | 37 | +4 | 0.99% | 1.80% | 2.33% |
| 19 | Muirhouse and Knowetop | 36 | +1 | 1.10% | 1.75% | 2.04% |
| 20 | Glenmavis and Greengairs | 36 | +9 | 1.25% | 1.75% | 1.79% |
| 21 | Milnwood | 34 | +1 | 1.46% | 1.65% | 1.44% |
| 22 | Drumgelloch | 34 | -10 | 1.69% | 1.65% | 1.25% |
| 23 | Holytown | 32 | -2 | 1.29% | 1.55% | 1.54% |
| 24 | Thrashbush | 32 | +5 | 1.23% | 1.55% | 1.62% |
| 25 | Sunnyside and Cliftonville | 31 | -4 | 1.51% | 1.50% | 1.27% |
| 26 | Abronhill South | 30 | -5 | 1.56% | 1.46% | 1.19% |
| 27 | Carfin and Cleekhimin | 29 | +1 | 1.28% | 1.41% | 1.40% |
| 28 | Westfield | 29 | +10 | 1.12% | 1.41% | 1.61% |
| 29 | Craigneuk Wishaw | 28 | +5 | 1.23% | 1.36% | 1.41% |
| 30 | Kirkwood and Bargeddie | 28 | 0 | 1.07% | 1.36% | 1.63% |
| 31 | Shotts | 27 | -1 | 1.32% | 1.31% | 1.27% |
| 32 | Chryston and Muirhead | 27 | +1 | 1.37% | 1.31% | 1.22% |
| 33 | Overtown | 26 | +7 | 1.37% | 1.26% | 1.18% |
| 34 | Pather | 25 | +3 | 1.36% | 1.21% | 1.14% |
| 35 | Ladywell | 25 | +5 | 1.16% | 1.21% | 1.34% |
| 36 | Coatbridge West | 25 | +6 | 1.26% | 1.21% | 1.24% |
| 37 | Condorrat | 25 | +2 | 1.17% | 1.21% | 1.32% |
| 38 | Greenfaulds | 25 | -8 | 1.42% | 1.21% | 1.09% |
| 39 | Cleland | 24 | +4 | 0.91% | 1.17% | 1.64% |
| 40 | Fallside | 24 | +6 | 1.01% | 1.17% | 1.47% |
| 41 | Coltness | 23 | 0 | 1.33% | 1.12% | 1.07% |
| 42 | Clydesdale and New Stevenston | 23 | +5 | 1.39% | 1.12% | 1.03% |
| 43 | Townhead | 23 | -6 | 1.09% | 1.12% | 1.31% |
| 44 | Cardowan and Millerston | 23 | -4 | 1.09% | 1.12% | 1.31% |
| 45 | Orbiston | 22 | +1 | 0.91% | 1.07% | 1.51% |
| 46 | Abronhill North | 22 | -4 | 1.16% | 1.07% | 1.18% |
| 47 | Newarthill | 21 | +6 | 1.45% | 1.02% | 0.90% |
| 48 | Bellshill Central | 21 | +5 | 1.18% | 1.02% | 1.11% |
| 49 | Greenend and Carnbroe | 20 | -3 | 0.80% | 0.97% | 1.55% |
| 50 | Stepps | 20 | -2 | 1.12% | 0.97% | 1.11% |
| 51 | Netherton and Kirkhill | 19 | +12 | 1.23% | 0.92% | 0.96% |
| 52 | Allanton - Newmains Rural | 19 | -4 | 1.28% | 0.92% | 0.92% |
| 53 | Stane | 19 | -1 | 1.38% | 0.92% | 0.85% |
| 54 | Balmalloch | 19 | +3 | 1.09% | 0.92% | 1.09% |
| 55 | Viewpark | 18 | -4 | 0.70% | 0.87% | 1.60% |
| 56 | Carfin North | 17 | +6 | 0.99% | 0.83% | 1.07% |
| 57 | Birkenshaw | 17 | -6 | 0.89% | 0.83% | 1.19% |
| 58 | Moodiesburn West | 17 | 0 | 1.37% | 1.31% | 1.22% |
| 59 | Drumpellier and Langloan | 16 | 0 | 1.43% | 0.78% | 0.70% |
| 60 | Gartlea | 16 | -1 | 1.17% | 0.78% | 0.85% |
| 61 | Moodiesburn East | 16 | +7 | 1.11% | 0.78% | 0.89% |
| 62 | Seafar | 16 | -2 | 0.98% | 0.78% | 1.02% |
| 63 | Kilsyth Bogside | 16 | -5 | 1.03% | 0.78% | 0.96% |
| 64 | Kirkshaws | 15 | -3 | 0.57% | 0.73% | 1.63% |
| 65 | Shawhead and Whifflet | 15 | +2 | 0.95% | 0.73% | 0.98% |
| 66 | Balloch West | 14 | +4 | 1.02% | 0.68% | 0.86% |
| 67 | Muirhouse | 13 | -1 | 0.66% | 0.63% | 1.21% |
| 68 | Motherwell North | 13 | +7 | 1.07% | 0.63% | 0.75% |
| 69 | Calderbank and Brownsburn | 13 | -1 | 1.19% | 0.63% | 0.68% |
| 70 | Craigneuk Airdrie | 13 | +2 | 0.88% | 0.63% | 0.92% |
| 71 | Chapelhall East | 12 | -2 | 0.77% | 0.58% | 0.97% |
| 72 | Balloch East | 12 | +9 | 0.99% | 0.58% | 0.75% |
| 73 | Chapelhall West | 11 | -6 | 0.99% | 0.53% | 0.69% |
| 74 | Petersburn | 11 | -7 | 0.65% | 0.53% | 1.05% |
| 75 | Wishaw East | 10 | -5 | 0.78% | 0.49% | 0.79% |
| 76 | Hattonrigg | 10 | +5 | 0.95% | 0.49% | 0.65% |
| 77 | Motherwell West | 7 | +7 | 0.38% | 0.34% | 1.15% |
| 78 | Carrickstone | 7 | -1 | 0.40% | 0.34% | 1.09% |
Where the % of homes is lower than % of LTE homes, it indicates areas with above average levels of empty homes.
For a full version of this report please contact the partnership’s data analyst at [email protected]
*This differs from the 6+ month empty figure published by Scottish Gov for North Lanarkshire- 2,634
**According to data published by SG
Sources