
West Lothian Local Authority
Figures published by National Records of Scotland show that West Lothian had 567 long-term empty homes in 2023. The table below shows how these long term empty homes are distributed across the Local Authority area.
• 0.67% of West Lothian’s homes were long term empty in 2023, compared to 1.70% in Scotland as a whole.
• 54.50% (309) of West Lothian’s long term empty homes have been empty for longer than one year.
• West Lothian accounts for 1.09% of homes empty for more than 1 year in Scotland.
West Lothian Planning and Coordination Officer:
Gillian Edwards (01506 281376)
West Lothian EHO:
Grace Lummi
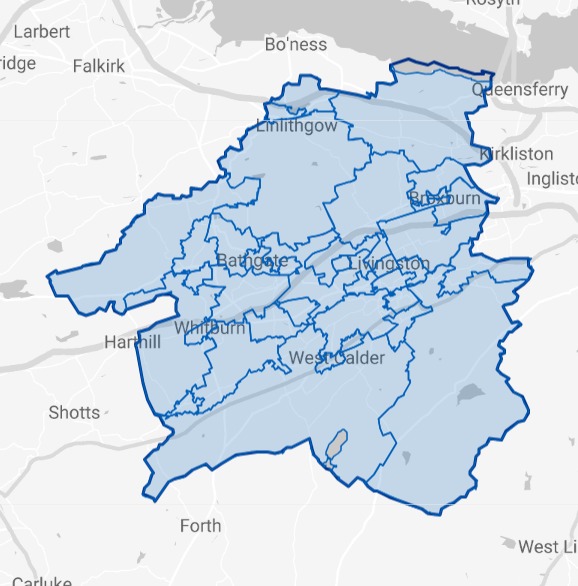
Please click on the map above to go to the Statistics.Gov.UK page for West Lothian. You can find out the location of each of the Intermediate Data Zones by clicking on 2011 Intermediate Zones under Locations on that page
| Intermediate Data Zones | Number of LTE Homes | Increase or Decrease 2022-2023 | % of Properties LTE | % of WL LTE | % of WL Homes | |
|---|---|---|---|---|---|---|
| 1 | Deans | 33 | -18 | 2.51% | 5.82% | 1.55% |
| 2 | Bathgate East | 32 | +2 | 0.97% | 5.64% | 3.89% |
| 3 | Winchburgh, Bridgend and Philpstoun | 28 | +11 | 0.92% | 4.94% | 3.57% |
| 4 | Linlithgow Bridge | 27 | -2 | 1.34% | 4.76% | 2.37% |
| 5 | East Calder | 23 | +4 | 0.61% | 4.06% | 4.46% |
| 6 | Knightsridge | 22 | +9 | 0.93% | 3.88% | 2.78% |
| 7 | Fauldhouse | 19 | 0 | 0.85% | 3.35% | 2.63% |
| 8 | Uphall, Dechmont and Ecclesmachan | 19 | +5 | 0.74% | 3.35% | 3.03% |
| 9 | Blaeberry Hill and East Whitburn | 18 | +2 | 0.63% | 3.17% | 3.37% |
| 10 | Armadale | 18 | +2 | 0.66% | 3.17% | 3.22% |
| 11 | Breich Valley | 17 | +12 | 0.78% | 3.00% | 2.55% |
| 12 | West Calder and Polbeth | 17 | +4 | 0.66% | 3.00% | 3.04% |
| 13 | Linlithgow South | 17 | 0 | 0.69% | 3.00% | 2.92% |
| 14 | Dedridge East | 16 | +7 | 0.61% | 2.82% | 3.09% |
| 15 | Livingston Village and Eliburn South | 16 | +9 | 0.74% | 2.82% | 2.56% |
| 16 | Carmondean and Eliburn North | 16 | 0 | 0.60% | 2.82% | 3.13% |
| 17 | Whitburn Central | 16 | +3 | 0.64% | 2.82% | 2.96% |
| 18 | Armadale South | 16 | +3 | 0.62% | 2.82% | 3.06% |
| 19 | Bankton and Murieston | 14 | +7 | 0.73% | 2.47% | 2.27% |
| 20 | Bathgate and Boghall | 14 | 0 | 0.71% | 2.47% | 2.32% |
| 21 | Broxburn South | 14 | 0 | 0.91% | 2.47% | 1.81% |
| 22 | Pumpherston and Uphall Station | 13 | +8 | 0.87% | 2.29% | 1.76% |
| 23 | Craigshill | 13 | 0 | 0.49% | 2.29% | 3.14% |
| 24 | Blackburn | 13 | -1 | 0.54% | 2.29% | 2.85% |
| 25 | Blackridge, Westfield and Torphichen | 13 | +3 | 0.76% | 2.29% | 2.01% |
| 26 | Bathgate West | 12 | +1 | 0.47% | 2.12% | 3.03% |
| 27 | Broxburn East | 12 | +2 | 0.78% | 2.12% | 1.80% |
| 28 | Mid Calder and Kirknewton | 11 | +3 | 0.40% | 1.94% | 3.26% |
| 29 | Knightsridge and Deans North | 10 | +2 | 0.63% | 1.76% | 1.87% |
| 30 | Bathgate, Wester Inch and Inchcross | 10 | +1 | 0.34% | 1.76% | 3.45% |
| 31 | Whitburn, Croftmalloch and Greenrigg | 8 | -3 | 0.32% | 1.41% | 2.96% |
| 32 | Broxburn Kirkhill | 8 | 0 | 0.39% | 1.41% | 2.39% |
| 33 | Bellsquarry, Adambrae and Kirkton | 7 | +1 | 0.29% | 1.23% | 2.89% |
| 34 | Howden | 7 | -4 | 0.34% | 1.23% | 2.42% |
| 35 | Ladywell | 7 | -3 | 0.32% | 1.23% | 2.56% |
| 36 | Seafield | 6 | +3 | 0.60% | 1.06% | 1.17% |
| 37 | Linlithgow North | 5 | -5 | 0.32% | 0.88% | 1.85% |
Where the % of homes is lower than % of long term empty homes, it indicates areas with above average levels of empty homes.
Sources
Small Area Statistics on Households and Dwellings | National Records of Scotland (nrscotland.gov.uk)
Housing statistics: Empty properties and second homes – gov.scot (www.gov.scot)