
South Lanarkshire Local Authority
Figures published by National Records of Scotland show that South Lanarkshire had 1,640 long-term empty homes in 2023. The table below shows how these long term empty homes are distributed across the Local Authority area.
• 1.03% of South Lanarkshire’s homes were long term empty in 2023, compared to 1.70% in Scotland as a whole.
• 91.04% (1,493) of South Lanarkshire’s long term empty homes have been empty for longer than one year.
• South Lanarkshire accounts for 5.28% of homes empty for more than 1 year in Scotland.
The EHOs for South Lanarkshire
Aileen Muir (01698 454121)
Julie Ann Gallagher ([email protected])
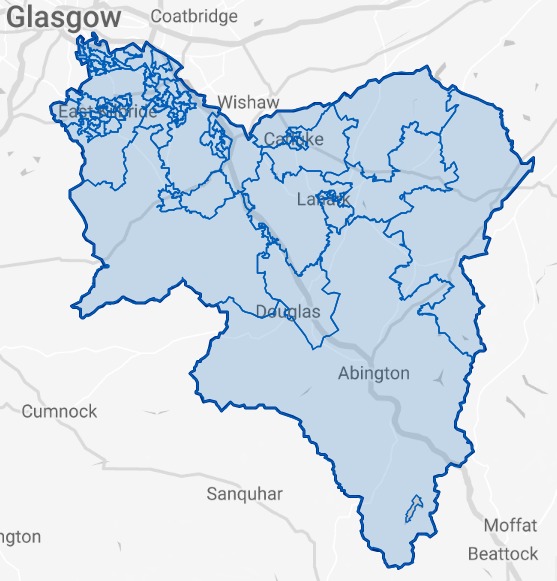
Please click on the map above to go to the Statistics.Gov.UK page for South Lanarkshire. You can find out the location of each of the Intermediate Data Zones by clicking on 2011 Intermediate Zones under Locations on that page
| Intermediate Data Zones | Number of LTE Homes | Increase or Decrease 2022-2023 | % of Properties LTE | % of South Lanarkshire LTEs | % of SL Homes | |
|---|---|---|---|---|---|---|
| 1 | Douglas, Coalburn and Rigside | 113 | +5 | 4.89% | 6.89% | 1.46% |
| 2 | Biggar, Symington, Thankerton and Dolphinton | 62 | +16 | 2.07% | 3.78% | 1.89% |
| 3 | Hamilton Centre and Low Parks | 45 | -4 | 1.70% | 2.74% | 1.67% |
| 4 | Clydesdale South | 40 | -6 | 3.10% | 2.44% | 0.81% |
| 5 | Stonehouse | 37 | +14 | 1.34% | 2.26% | 1.74% |
| 6 | High Blantyre | 37 | +10 | 1.83% | 2.26% | 1.27% |
| 7 | Carstairs, Carstairs Junction and Carnwath | 34 | +9 | 1.50% | 2.07% | 1.43% |
| 8 | Lanark South | 31 | +5 | 1.62% | 1.89% | 1.20% |
| 9 | Burnbank Central and Udston | 30 | +4 | 1.16% | 1.83% | 1.63% |
| 10 | Strathaven South | 29 | +3 | 1.31% | 1.77% | 1.40% |
| 11 | Laighstonehall | 29 | +2 | 1.41% | 1.77% | 1.29% |
| 12 | St Leonards South | 28 | +7 | 1.28% | 1.71% | 1.38% |
| 13 | Forth, Braehead and Auchengray | 27 | +1 | 1.57% | 1.65% | 1.08% |
| 14 | Burnhill and Bankhead North | 27 | +12 | 1.48% | 1.65% | 1.15% |
| 15 | Hazelbank and Kirkfieldbank | 26 | +8 | 1.35% | 1.59% | 1.21% |
| 16 | Larkhall Central, Raploch, Millheugh and Burnhead | 26 | -6 | 1.25% | 1.59% | 1.31% |
| 17 | The Murray | 26 | -1 | 1.29% | 1.59% | 1.27% |
| 18 | Lesmahagow | 24 | -1 | 1.37% | 1.46% | 1.10% |
| 19 | Fernhill and Cathkin | 23 | +4 | 1.09% | 1.40% | 1.33% |
| 20 | Calderwood West and Nerston | 23 | +10 | 1.07% | 1.40% | 1.35% |
| 21 | Westwood South | 23 | +8 | 1.14% | 1.40% | 1.28% |
| 22 | Burgh, Eastfield and Silverbank | 22 | -3 | 0.82% | 1.34% | 1.69% |
| 23 | Burnside and Springhall | 22 | -1 | 0.97% | 1.34% | 1.43% |
| 24 | Nerston and EK Landward Area | 22 | 0 | 0.48% | 1.34% | 2.87% |
| 25 | Thorntonhall, Jackton and Gardenhall | 22 | +1 | 1.20% | 1.34% | 1.15% |
| 26 | Lanark North West | 21 | +4 | 1.55% | 1.28% | 0.86% |
| 27 | Blantyre South and Wheatlands | 21 | +3 | 0.99% | 1.28% | 1.34% |
| 28 | Whitehill | 21 | +5 | 1.01% | 1.28% | 1.30% |
| 29 | Calderwood East | 21 | -2 | 1.15% | 1.28% | 1.15% |
| 30 | Bothwell South | 20 | -2 | 1.07% | 1.22% | 1.18% |
| 31 | Vicarland and Cairns | 20 | -3 | 0.99% | 1.22% | 1.28% |
| 32 | Hairmyres and Westwood West | 20 | +2 | 1.16% | 1.22% | 1.09% |
| 33 | Law | 19 | +4 | 1.03% | 1.16% | 1.16% |
| 34 | Strathaven North | 19 | +7 | 1.47% | 1.16% | 0.82% |
| 35 | Uddingston and Gardenside | 19 | +14 | 0.60% | 1.16% | 2.00% |
| 36 | Calderwood Central | 19 | +4 | 0.86% | 1.16% | 1.39% |
| 37 | East Mains | 19 | -3 | 1.13% | 1.16% | 1.06% |
| 38 | Westwood East | 19 | +2 | 1.07% | 1.16% | 1.12% |
| 39 | HIllhouse | 18 | -7 | 0.90% | 1.10% | 1.26% |
| 40 | Farme Cross and Gallowflat North | 18 | +5 | 0.77% | 1.10% | 1.47% |
| 41 | Shawfield and Clincarthill | 18 | -4 | 0.87% | 1.10% | 1.30% |
| 42 | St Leonards North | 18 | +6 | 0.78% | 1.10% | 1.45% |
| 43 | Kirkmuirhill and Blackwood | 17 | +4 | 0.89% | 1.04% | 1.20% |
| 44 | Strutherhill | 17 | +5 | 0.96% | 1.04% | 1.11% |
| 45 | Glassford, Quarter and Allanton | 17 | -4 | 0.83% | 1.04% | 1.29% |
| 46 | Birniehill, Kelvin and Whitehills East | 16 | +6 | 0.88% | 0.98% | 1.15% |
| 47 | Lanark North East | 15 | +3 | 1.27% | 0.91% | 0.74% |
| 48 | Hareleeshill | 15 | -5 | 0.74% | 0.91% | 1.28% |
| 49 | Burnbank North | 15 | -4 | 0.63% | 0.91% | 1.49% |
| 50 | Carluke North | 14 | +4 | 1.10% | 0.85% | 0.81% |
| 51 | Carluke East | 14 | +1 | 0.74% | 0.85% | 1.19% |
| 52 | Chapelton, Glengavel and Sandford | 14 | -4 | 0.93% | 0.85% | 0.95% |
| 53 | Earnock | 14 | +8 | 0.77% | 0.85% | 1.15% |
| 54 | Blantytre North and Coatshill | 14 | +5 | 0.91% | 0.85% | 0.97% |
| 55 | Burnbank South and Chantinghall | 14 | -2 | 0.76% | 0.85% | 1.16% |
| 56 | Cambuslang Central | 14 | +1 | 0.76% | 0.85% | 1.16% |
| 57 | High Crosshill | 14 | +8 | 0.81% | 0.85% | 1.09% |
| 58 | Carluke South | 13 | +1 | 0.79% | 0.79% | 1.03% |
| 59 | Bankhead South | 13 | +5 | 0.85% | 0.79% | 0.96% |
| 60 | West Mains | 13 | -8 | 0.86% | 0.79% | 0.95% |
| 61 | Crosshouse and Lindsayfield | 13 | -2 | 0.63% | 0.79% | 1.30% |
| 62 | Whitehills West | 13 | -3 | 0.72% | 0.79% | 1.14% |
| 63 | Crossford, Braidwood and Yieldshields | 12 | -1 | 0.84% | 0.73% | 0.90% |
| 64 | Ashgill and Netherburn | 12 | -10 | 0.76% | 0.73% | 0.99% |
| 65 | Merryton and Meadowhill | 12 | +3 | 0.80% | 0.73% | 0.95% |
| 66 | Low Waters | 12 | -10 | 0.80% | 0.73% | 0.95% |
| 67 | Woodhead and Meikle Earnock | 12 | -2 | 0.95% | 0.73% | 0.80% |
| 68 | Low Blantyre and Bardykes | 12 | +8 | 0.87% | 0.73% | 0.87% |
| 69 | Westburn and Newton | 12 | -3 | 0.45% | 0.73% | 1.70% |
| 70 | Whitlawburn and Greenlees | 12 | -1 | 0.54% | 0.73% | 1.40% |
| 71 | Carluke West | 11 | 0 | 0.81% | 0.67% | 0.86% |
| 72 | Halfway, Hallside and Drumsagard | 11 | +5 | 0.31% | 0.67% | 2.21% |
| 73 | Greenhills | 11 | +4 | 0.79% | 0.67% | 0.87% |
| 74 | Little Earnock | 10 | -6 | 0.32% | 0.61% | 1.99% |
| 75 | Mossneuk and Newlandsmuir | 10 | 0 | 0.77% | 0.61% | 0.82% |
| 76 | Bothwell North | 9 | +1 | 0.66% | 0.55% | 0.86% |
| 77 | Stewartfield East | 9 | -4 | 0.83% | 0.55% | 0.68% |
| 78 | Silvertonhill | 7 | -3 | 0.50% | 0.43% | 0.88% |
| 79 | Spittal | 6 | -3 | 0.40% | 0.37% | 0.94% |
| 80 | Stewartfield West | 6 | -4 | 0.35% | 0.37% | 1.10% |
| 81 | Eddlewood | 4 | -1 | 0.28% | 0.24% | 0.90% |
| 82 | Fairhill | 3 | -6 | 0.31% | 0.18% | 0.60% |
Where the % of homes is lower than % of long term empty homes, it indicates areas with above average levels of empty homes.
Sources
Small Area Statistics on Households and Dwellings | National Records of Scotland (nrscotland.gov.uk
Housing statistics: Empty properties and second homes – gov.scot (www.gov.scot)