
Scottish Borders Local Authority
Figures published by National Records of Scotland show that Scottish Borders had 1,579 long-term empty homes in 2023. The table below shows how these long term empty homes are distributed across the Local Authority area.
• 2.63% of Scottish Borders homes were long term empty in 2023, compared to 1.70% in Scotland as a whole.
• 63.27% (999) of Scottish Borders long term empty homes have been empty for longer than one year.
• Scottish Borders accounts for 3.53% of homes empty for more than 1 year in Scotland.
The EHO for Scottish Borders
Rachel Whale (01896 661 392 switchboard)
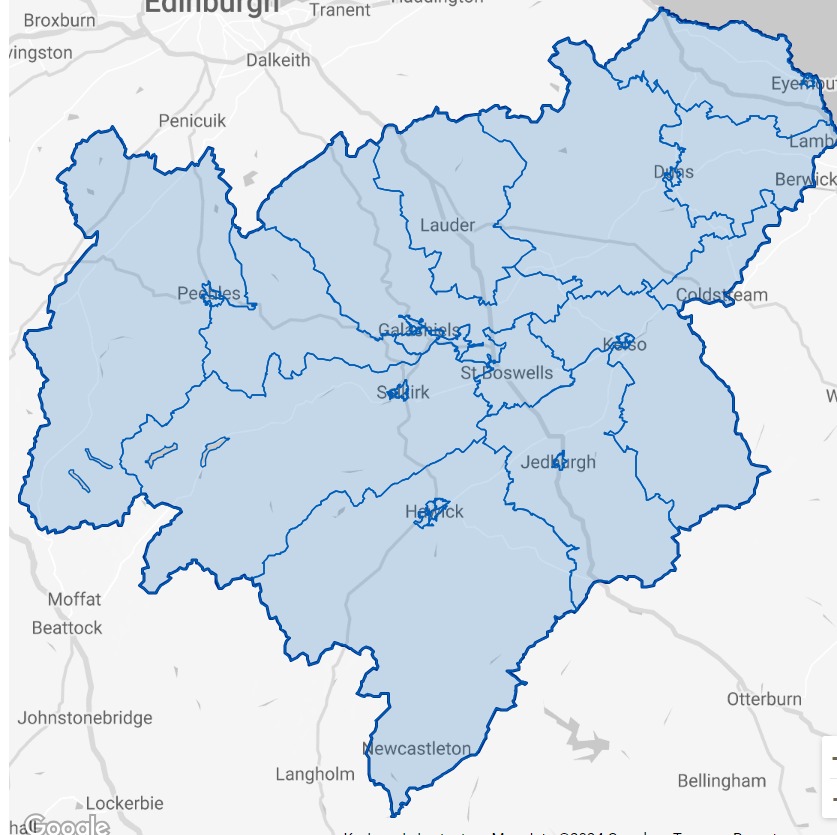
Please click on the map above to go to the Statistics.Gov.UK page for Scottish Borders. You can find out the location of each of the Intermediate Data Zones by clicking on 2011 Intermediate Zones under Locations on that page
| Intermediate Data Zones | Number of LTE Homes | Increase or Decrease 2022-2023 | % of Properties LTE | % of SB LTEs | % of SB Homes | |
|---|---|---|---|---|---|---|
| 1 | Hawick Central | 145 | +3 | 5.49% | 9.18% | 4.41% |
| 2 | Galashiels North | 79 | 0 | 3.81% | 5.00% | 3.46% |
| 3 | Tweeddale West Area | 75 | +16 | 2.64% | 4.75% | 4.73% |
| 4 | Berwickshire Central | 75 | +2 | 3.63% | 4.75% | 3.44% |
| 5 | Cheviot East | 68 | +11 | 2.75% | 4.31% | 4.12% |
| 6 | Selkirk | 66 | +25 | 2.25% | 4.18% | 4.88% |
| 7 | Denholm and Heritage | 62 | -3 | 2.91% | 3.93% | 3.55% |
| 8 | St Boswells and Newtown Area | 60 | +15 | 3.26% | 3.80% | 3.07% |
| 9 | Chirnside and Area | 58 | +4 | 2.76% | 3.67% | 3.50% |
| 10 | Jedburgh | 58 | +9 | 2.90% | 3.67% | 3.34% |
| 11 | Melrose and Tweedbank area | 54 | +1 | 2.08% | 3.42% | 4.33% |
| 12 | Galashiels West | 52 | -6 | 4.09% | 3.29% | 2.86% |
| 13 | Earlston Stow and Clovernfords Area | 51 | +1 | 1.75% | 3.23% | 4.87% |
| 14 | Cheviot West | 51 | -5 | 3.41% | 3.23% | 2.49% |
| 15 | Ettrick Yarrow and Liliesleaf Area | 50 | +10 | 3.46% | 3.17% | 2.41% |
| 16 | Tweeddale East Area | 49 | -2 | 1.69% | 3.10% | 4.83% |
| 17 | Hawick North | 48 | -5 | 2.63% | 3.04% | 3.05% |
| 18 | Berwickshire East | 47 | +7 | 2.14% | 2.98% | 3.67% |
| 19 | Peebles North | 45 | 0 | 1.87% | 2.85% | 4.01% |
| 20 | Kelso South | 45 | +11 | 3.07% | 2.85% | 2.44% |
| 21 | Hawick West End | 44 | -1 | 2.47% | 2.79% | 2.97% |
| 22 | Galashiels South | 43 | +9 | 2.53% | 2.72% | 2.84% |
| 23 | Burnfoot | 42 | +8 | 3.13% | 2.66% | 2.23% |
| 24 | Coldstream and Area | 35 | -7 | 2.21% | 2.22% | 2.64% |
| 25 | Duns | 34 | +11 | 2.17% | 2.15% | 2.61% |
| 26 | Eyemouth | 33 | +1 | 1.91% | 2.09% | 2.88% |
| 27 | Langlee | 26 | +2 | 1.81% | 1.65% | 2.39% |
| 28 | Kelso North | 19 | +2 | 1.19% | 1.20% | 2.67% |
| 29 | Lauder and Area | 17 | -5 | 1.20% | 1.08% | 2.35% |
| 30 | Peebles South | 13 | 0 | 0.74% | 0.82% | 2.94% |
Where the % of homes is lower than % of long term empty homes, it indicates areas with above average levels of empty homes.
Sources
Small Area Statistics on Households and Dwellings | National Records of Scotland (nrscotland.gov.uk)
Housing statistics: Empty properties and second homes – gov.scot (www.gov.scot)