Skip to content

Perth & Kinross Local Authority

Figures published by National Records of Scotland show that Perth & Kinross had 1,275 long-term empty homes in 2023. The table below shows how these long term empty homes are distributed across the Local Authority area.


• 1.67% of Perth & Kinross homes were long term empty in 2023, compared to 1.70% in Scotland as a whole.

• 60.86% (776) of Perth & Kinross long term empty homes have been empty for longer than one year. 

• Perth & Kinross accounts for 2.74% of homes empty for more than 1 year in Scotland.


Perth & Kinross Vacant Property Development Officer

Thomas Waterworth ([email protected])

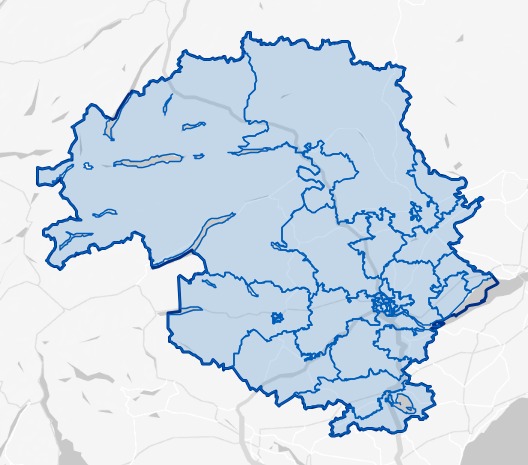
Please click on the map above to go to the Statistics.Gov.UK page for Perth & Kinross. You can find out the location of each of the Intermediate Data Zones by clicking on 2011 Intermediate Zones under Locations on that page


Intermediate Data ZonesNumber of LTE HomesIncrease or Decrease 2022-2023% of Properties LTE% of P&K LTEs% of P&K Homes
1Central and South Inch150-14.64%11.76%4.25%
2Rannoch and Aberfeldy86-62.89%6.75%3.91%
3Blair Atholl, Strathardle and Glenshee78+183.15%6.12%3.25%
4Coupar Angus and Meigle56+82.20%4.39%3.34%
5Comrie, Gilmerton and St Fillans54+52.66%4.24%2.67%
6Luncarty and Dunkeld53-71.69%4.16%4.12%
7Muthill, Greenloaning and Gleneagles51+42.49%4.00%2.69%
8North Inch51-293.73%4.00%1.80%
9Pitlochry47+62.29%3.69%2.70%
10Stanley and Murthly4201.84%3.29%3.00%
11Crieff South4101.94%3.22%2.78%
12Alyth40+152.50%3.14%2.10%
13Blairgowrie West39-11.35%3.06%3.79%
14Aberuthven and Almondbank38+31.61%2.98%3.09%
15Guildtown, Balbeggie and St Madoes34+61.75%2.67%2.55%
16Auchterarder33+41.63%2.59%2.67%
17Viewlands, Craigie and Wellshill32-21.10%2.51%3.82%
18Glenfarg, Dunning and Rhynd29+61.35%2.27%2.82%
19Powmill, Cleish and Scotlandwell26+21.36%2.04%2.51%
20Crieff North25+31.68%1.96%1.95%
21Hillyland, Tulloch and Inveralmond25+30.94%1.96%3.51%
22Bridge of Earn and Abernethy23-30.93%1.80%3.24%
23Gannochy and Walnut Grove22+51.25%1.73%2.32%
24Errol and Inchture22-41.16%1.73%2.48%
25Milnathort and Crook of Devon21+41.14%1.65%2.43%
26Kinross20-10.84%1.57%3.15%
27Letham20+20.75%1.57%3.52%
28Invergowrie, Longforgan and Abernyte19-11.08%1.49%2.32%
29Blairgowrie East (Rattray)19+11.28%1.49%1.95%
30Scone18-80.69%1.41%3.41%
31Muirton15-50.87%1.18%2.28%
32Moncrieffe and Friarton13-60.73%1.02%2.33%
33North Muirton and Old Scone13-40.81%1.02%2.10%
34Burghmuir and Oakbank10-50.51%0.78%2.56%
35Western Edge10-10.50%0.78%2.62%

Where the % of homes is lower than % of long term empty homes, it indicates areas with above average levels of empty homes.


Sources

Small Area Statistics on Households and Dwellings | National Records of Scotland (nrscotland.gov.uk)

Housing statistics: Empty properties and second homes – gov.scot (www.gov.scot)