
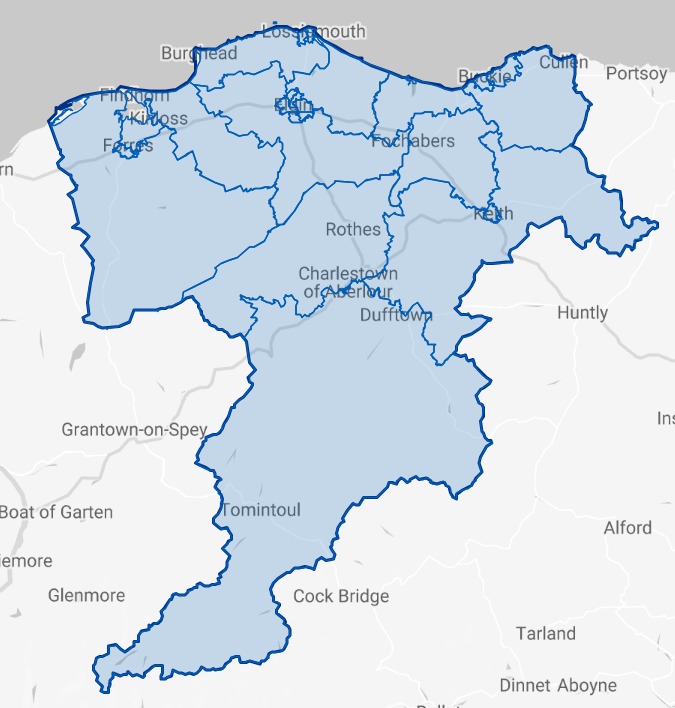
Moray Local Authority
Figures published by National Records of Scotland show that Moray had 927 long-term empty homes in 2023. The table below shows how these long term empty homes are distributed across the Local Authority area.
• 1.97% of Moray’s homes were long term empty in 2023, compared to 1.70% in Scotland as a whole.
• 58.14% (539) of Moray’s long term empty homes have been empty for longer than one year.
• Moray accounts for 1.91% of homes empty for more than 1 year in Scotland.
Moray does not have an empty homes officer. For empty homes enquiries please contact 0344 515 1941 or email [email protected]
Please click on the map above to go to the Statistics.Gov.UK page for Moray. You can find out the location of each of the Intermediate Data Zones by clicking on 2011 Intermediate Zones under Locations on that page
| Intermediate Data Zones | Number of LTE Homes | Increase or Decrease 2022-2023 | % of Properties LTE | % of Moray LTEs | % of Moray Homes | |
|---|---|---|---|---|---|---|
| 1 | South Speyside and the Cabrach | 85 | +1 | 3.93% | 9.17% | 4.60% |
| 2 | North Speyside | 74 | +12 | 4.01% | 7.98% | 3.92% |
| 3 | Rural Keith and Strathisla | 68 | +13 | 4.59% | 7.34% | 3.15% |
| 4 | Keith and Fife Keith | 63 | +18 | 2.64% | 6.80% | 5.07% |
| 5 | Cullen, Portknockie, Findochty, Drybridge and Berryhillock | 63 | +3 | 2.34% | 6.80% | 5.71% |
| 6 | Buckie West and Mains of Buckie | 55 | +2 | 2.22% | 5.93% | 5.27% |
| 7 | Forres Central East and seaward | 48 | +9 | 2.34% | 5.18% | 4.36% |
| 8 | Rafford, Dallas, Dyke to Dava | 44 | +9 | 2.07% | 4.75% | 4.53% |
| 9 | Burghead, Roseisle and Laich | 41 | -1 | 1.71% | 4.42% | 5.08% |
| 10 | Lossiemouth East and Seatown | 40 | -1 | 2.33% | 4.31% | 3.65% |
| 11 | Heldon West, Fogwatt to Inchberry | 37 | +3 | 1.34% | 3.99% | 5.87% |
| 12 | Findhorn, Kinloss and Pluscarden Valley | 37 | +6 | 2.15% | 3.99% | 3.66% |
| 13 | Elgin Central West | 36 | +1 | 2.23% | 3.88% | 3.43% |
| 14 | Elgin Cathedral to Ashgrove and Pinefield | 32 | +1 | 1.50% | 3.45% | 4.53% |
| 15 | Elgin Bishopmill East and Ladyhill | 31 | 0 | 1.86% | 3.34% | 3.54% |
| 16 | Fochabers, Aultmore, Clochan and Ordiquish | 27 | +6 | 2.13% | 2.91% | 2.70% |
| 17 | Buckie Central East | 24 | -1 | 1.40% | 2.59% | 3.64% |
| 18 | Mosstodloch, Portgordon and seaward | 22 | -1 | 1.23% | 2.37% | 3.81% |
| 19 | Lhanbryde, Urquhart, Pitgavney and seaward | 21 | -1 | 1.13% | 2.27% | 3.95% |
| 20 | New Elgin West | 19 | +9 | 1.06% | 2.05% | 3.80% |
| 21 | Forres South West and Mannachie | 18 | +1 | 0.69% | 1.94% | 5.51% |
| 22 | Lossiemouth West | 16 | +5 | 1.02% | 1.73% | 3.33% |
| 23 | New Elgin East | 15 | +5 | 0.83% | 1.62% | 3.86% |
| 24 | Elgin Bishopmill West and Newfield | 11 | +3 | 0.78% | 1.19% | 3.02% |
Where the % of homes is lower than % of long term empty homes, it indicates areas with above average levels of empty homes.
Sources
Small Area Statistics on Households and Dwellings | National Records of Scotland (nrscotland.gov.uk)
Housing statistics: Empty properties and second homes – gov.scot (www.gov.scot)