
Fife Local Authority
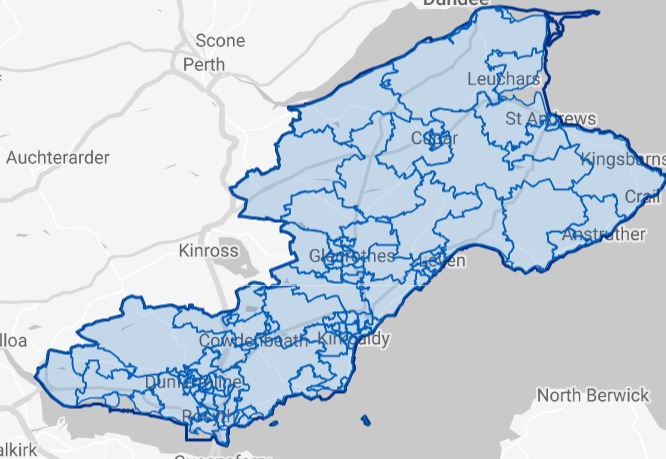
Figures published by National Records of Scotland show that Fife had 2,489 long-term empty homes in 2023. The map and table below shows how these long term empty homes are distributed across the Local Authority area.
• 1.36% of Fife’s homes were long term empty in 2023, compared to 1.70% in Scotland as a whole.
• 76.78% (1,911) of Fife’s long term empty homes have been empty for longer than one year.
• Fife accounts for 6.76% of homes empty for more than 1 year in Scotland.
The EHOs for Fife
Joanne Saurin (01592 583540)
Mark McArthur (01592 583540)
Please click on the map above to go to the Statistics.Gov.UK page for Fife. You can find out the location of each of the Intermediate Data Zones by clicking on 2011 Intermediate Zones under Locations on that page
| Intermediate Data Zones | Number of LTE Homes | Increase or Decrease 2022-2023 | % of Properties LTE | % of Fife LTEs | % of Fife Homes | |
|---|---|---|---|---|---|---|
| 1 | St Andrews Central | 127 | -14 | 4.89% | 5.10% | 1.42% |
| 2 | Lochgelly East | 60 | +1 | 2.61% | 2.41% | 1.26% |
| 3 | Dunfermline Baldridgeburn | 53 | +12 | 2.37% | 2.13% | 1.22% |
| 4 | Buckhaven, Deanbeath, and Muiredge | 51 | +2 | 1.85% | 2.05% | 1.50% |
| 5 | Glenrothes Macedonia and Tanshall | 49 | +10 | 2.28% | 1.97% | 1.17% |
| 6 | Methil West | 49 | +14 | 3.45% | 1.97% | 0.78% |
| 7 | Methil East | 48 | +3 | 2.54% | 1.93% | 1.03% |
| 8 | Kirkcaldy Bennochy East | 47 | +9 | 2.59% | 1.89% | 0.99% |
| 9 | Anstruther | 46 | -5 | 1.96% | 1.85% | 1.28% |
| 10 | Dunfermline Central | 44 | -11 | 2.20% | 1.77% | 1.10% |
| 11 | St Andrews North and Strathkinness | 43 | -5 | 2.81% | 1.73% | 0.84% |
| 12 | Kirkcaldy Central | 42 | -11 | 2.05% | 1.69% | 1.12% |
| 13 | Leven East | 42 | -1 | 2.22% | 1.69% | 1.04% |
| 14 | Cowdenbeath North | 40 | -9 | 1.63% | 1.61% | 1.34% |
| 15 | Kirkcaldy Linktown & Seafield | 40 | -4 | 1.67% | 1.61% | 1.31% |
| 16 | St Andrews South East | 40 | +3 | 2.27% | 1.61% | 0.96% |
| 17 | St Andrews South West | 40 | +1 | 2.17% | 1.61% | 1.01% |
| 18 | Balmullo and Gauldry | 39 | +9 | 1.80% | 1.57% | 1.18% |
| 19 | Cardenden | 37 | +3 | 1.11% | 1.49% | 1.82% |
| 20 | Cupar Central | 37 | -6 | 2.11% | 1.49% | 0.96% |
| 21 | Dunfermline Headwell | 36 | 0 | 1.51% | 1.45% | 1.30% |
| 22 | Aberdour and Auchtertool | 36 | +15 | 2.03% | 1.45% | 0.97% |
| 23 | Eli Colinsburgh and Largoward | 36 | -1 | 2.27% | 1.45% | 0.87% |
| 24 | Vallyfield Culross & Torryburn | 33 | +8 | 1.76% | 1.33% | 1.03% |
| 25 | Braehead and the Path | 33 | -1 | 1.88% | 1.33% | 0.96% |
| 26 | Thornton and Kinglassie | 33 | +1 | 1.65% | 1.33% | 1.09% |
| 27 | Kettle and Ladybank | 33 | +15 | 1.66% | 1.33% | 1.09% |
| 28 | Auchtermuchty and Gateside | 32 | -7 | 1.70% | 1.29% | 1.03% |
| 29 | Largo | 31 | +11 | 1.80% | 1.25% | 0.94% |
| 30 | St Monans and Pittenweem | 31 | +2 | 1.79% | 1.25% | 0.95% |
| 31 | Burntisland West | 30 | -5 | 1.55% | 1.21% | 1.06% |
| 32 | Kennoway and Bonnybank | 30 | +10 | 1.19% | 1.21% | 1.38% |
| 33 | Dunfermline Touch and Woodmill | 29 | +12 | 1.97% | 1.17% | 0.81% |
| 34 | Kircaldy Gallatown and Sinclairtown | 29 | -3 | 1.07% | 1.17% | 1.48% |
| 35 | Dysart | 29 | -1 | 1.48% | 1.17% | 1.07% |
| 36 | Dairse Ceres and Dunino | 29 | 0 | 2.03% | 1.17% | 0.78% |
| 37 | Newport and Wormit | 29 | +2 | 1.47% | 1.17% | 1.08% |
| 38 | Glenrothes Caskieberran and Rimbleton | 27 | +2 | 1.30% | 1.08% | 1.14% |
| 39 | Falkland and Freuchie | 26 | +4 | 2.22% | 1.04% | 0.64% |
| 40 | Tayport | 26 | 0 | 1.36% | 1.04% | 1.04% |
| 41 | Markinch and Star | 25 | +1 | 1.23% | 1.00% | 1.11% |
| 42 | Oakley, Comrie, and Blairhall | 23 | +6 | 1.20% | 0.92% | 1.05% |
| 43 | Rosyth Central | 23 | +1 | 1.32% | 0.92% | 0.95% |
| 44 | Leslie and Newcastle | 23 | -7 | 1.14% | 0.92% | 1.11% |
| 45 | Methil Methilhill | 23 | +8 | 1.11% | 0.92% | 1.13% |
| 46 | Salineand Gowkhall | 22 | +10 | 1.20% | 0.88% | 1.00% |
| 47 | Kircaldy Hayfield and Smeaton | 22 | +3 | 1.27% | 0.88% | 0.95% |
| 48 | Glenrothes Auchmuty | 22 | +4 | 1.40% | 0.88% | 0.86% |
| 49 | North Queensferry and Inverkeithing West | 21 | -14 | 1.31% | 0.84% | 0.88% |
| 50 | Hill of Beath and Kingseat | 21 | +9 | 1.26% | 0.84% | 0.91% |
| 51 | Cupar West and Springfield | 21 | +5 | 1.19% | 0.84% | 0.96% |
| 52 | Kincardine | 20 | +3 | 1.26% | 0.80% | 0.86% |
| 53 | Crossford Charleston and Limekilns | 20 | -5 | 1.02% | 0.80% | 1.07% |
| 54 | Dunfermline Bellyeoman and Townhill | 20 | -1 | 0.80% | 0.80% | 1.36% |
| 55 | Lochore and Crosshill | 20 | +9 | 1.47% | 0.80% | 0.74% |
| 56 | Glenrothes Auchmuty | 20 | +7 | 1.23% | 0.80% | 0.89% |
| 57 | Glenrothes Pitteuchar | 20 | +3 | 0.90% | 0.80% | 1.21% |
| 58 | Crail and Boarhills | 20 | -10 | 1.19% | 0.80% | 0.92% |
| 59 | Leuchars and Guardbridge | 20 | 0 | 1.29% | 0.80% | 0.85% |
| 60 | Kelty East | 19 | -5 | 0.96% | 0.76% | 1.08% |
| 61 | Lochgelly West and Lumphinnans | 19 | -12 | 1.19% | 0.76% | 0.87% |
| 62 | Kircaldy Templehall West | 19 | +5 | 1.25% | 0.76% | 0.83% |
| 63 | Wemyss | 19 | +7 | 1.07% | 0.76% | 0.97% |
| 64 | Kircaldy Templehall East | 17 | -11 | 0.76% | 0.68% | 1.23% |
| 65 | Glenrothes Collydean | 17 | +3 | 1.62% | 0.68% | 0.57% |
| 66 | Inverkeithing East | 16 | +1 | 0.93% | 0.64% | 0.94% |
| 67 | Kinghorn | 16 | -2 | 1.11% | 0.64% | 0.79% |
| 68 | Windygates and Coaltown | 16 | -5 | 0.99% | 0.64% | 0.88% |
| 69 | Dunfermline Brucefield | 15 | -3 | 0.97% | 0.60% | 0.84% |
| 70 | Burntisland East | 15 | +8 | 1.15% | 0.60% | 0.71% |
| 71 | Cowdenbeath South | 14 | -1 | 0.93% | 0.56% | 0.82% |
| 72 | Kircaldy Chapel | 14 | +1 | 0.64% | 0.56% | 1.20% |
| 73 | Glenrothes Cadham and Pitcoudie | 14 | +2 | 1.32% | 0.56% | 0.58% |
| 74 | Dunfermline Abbeyview North | 13 | +2 | 0.69% | 0.52% | 1.03% |
| 75 | Rosyth East | 13 | +1 | 0.90% | 0.52% | 0.79% |
| 76 | Crossgates and Halbeath | 13 | -1 | 0.82% | 0.52% | 0.87% |
| 77 | Ballingry | 13 | +5 | 1.00% | 0.52% | 0.71% |
| 78 | Kirkcaldy Bennochy West | 13 | -1 | 0.92% | 0.52% | 0.77% |
| 79 | Glenrothes Woodside | 13 | +8 | 1.06% | 0.52% | 0.67% |
| 80 | Leven West | 13 | -4 | 0.73% | 0.52% | 0.97% |
| 81 | Leven North | 13 | +1 | 1.06% | 0.52% | 0.67% |
| 82 | Kirkcaldy Raith | 12 | +4 | 1.03% | 0.48% | 0.64% |
| 83 | Dunfermline Abbeyview South | 11 | -2 | 0.85% | 0.44% | 0.70% |
| 84 | Cairneyhill and Crombie | 10 | -1 | 0.75% | 0.40% | 0.73% |
| 85 | Dalgety Bay Central | 10 | -6 | 0.48% | 0.40% | 1.14% |
| 86 | Dunfermline Milesmark and Wellwood | 9 | -1 | 0.55% | 0.36% | 0.90% |
| 87 | Rosyth North | 9 | +1 | 0.65% | 0.36% | 0.76% |
| 88 | Glenrothes Balfarg Pitcairn and Coul | 9 | +1 | 0.71% | 0.36% | 0.69% |
| 89 | Dunfermline Duloch South | 8 | +5 | 0.59% | 0.32% | 0.74% |
| 90 | Cupar East | 8 | -6 | 0.42% | 0.32% | 1.04% |
| 91 | Rosyth South | 7 | -14 | 0.50% | 0.28% | 0.76% |
| 92 | Glenrothes South Parks | 7 | -3 | 0.64% | 0.28% | 0.59% |
| 93 | Dunfermline Garvock Hill | 6 | -3 | 0.44% | 0.24% | 0.74% |
| 94 | Dunfermline Duloch North and Lynebank | 6 | 0 | 0.24% | 0.24% | 1.37% |
| 95 | Kelty West | 6 | -3 | 0.48% | 0.24% | 0.68% |
| 96 | Kirkcaldy Newliston and Redcraigs | 6 | +3 | 0.41% | 0.24% | 0.80% |
| 97 | Glenrothes Stentonand Finglassie | 6 | -1 | 0.40% | 0.24% | 0.83% |
| 98 | Dunfermline Masterton | 5 | -5 | 0.29% | 0.20% | 0.95% |
| 99 | Dalgety Bay East | 5 | 0 | 0.45% | 0.20% | 0.61% |
| 100 | Kircaldy Dunnikier | 5 | -1 | 0.35% | 0.20% | 0.77% |
| 101 | Dunfermline Pitcorthie East | 4 | -1 | 0.27% | 0.16% | 0.82% |
| 102 | Dunfermline Pitcorthie West | 4 | -3 | 0.35% | 0.16% | 0.63% |
| 103 | Dalgety Bay West and Hillend | 2 | 0 | 0.20% | 0.08% | 0.55% |
| 104 | Glenrothes Balgeddie and Town Park | 2 | 0 | 0.12% | 0.08% | 0.91% |
Where the % of homes is lower than % of long term empty homes, it indicates areas with above average levels of empty homes.
Sources
Small Area Statistics on Households and Dwellings | National Records of Scotland (nrscotland.gov.uk)
Housing statistics: Empty properties and second homes – gov.scot (www.gov.scot)