
Falkirk Local Authority
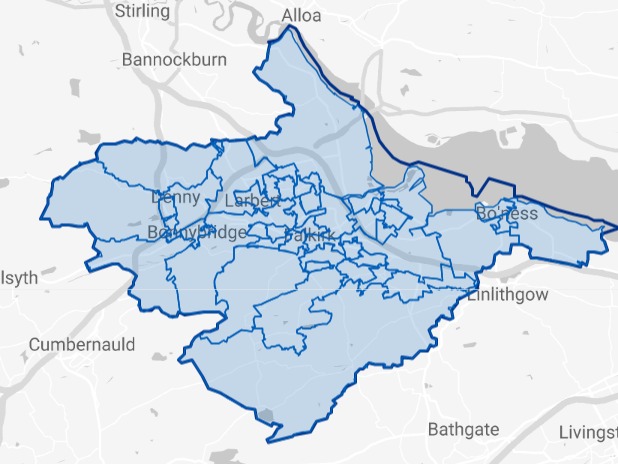
Figures published by National Records of Scotland show that Falkirk had 795 long-term empty homes in 2023. The map and table below shows how these long term empty homes are distributed across the Local Authority area.
• 1.04% of Falkirk’s homes were long term empty in 2023, compared to 1.70% in Scotland as a whole.
• 45.41% (361) of Falkirk’s long term empty homes have been empty for longer than one year.
• Falkirk accounts for 1.28% of homes empty for more than 1 year in Scotland.
The EHOs for Falkirk are:
Elaine Hall (07738627139)
Wendy Laird (07921 942232)
Please click on the map above to go to the Statistics.Gov.UK page for Falkirk. You can find out the location of each of the Intermediate Data Zones by clicking on 2011 Intermediate Zones under Locations on that page
| Intermediate Data Zones | Number of LTE Homes | Increase or decrease 2022-2023 | % of Properties LTE | % of Falkirk LTEs | % of Falkirk homes | |
|---|---|---|---|---|---|---|
| 1 | Falkirk - Town Centre and Callendar Park | 47 | -6 | 1.96% | 5.91% | 3.13% |
| 2 | Grangemouth - Newlands | 40 | +6 | 1.62% | 5.03% | 3.23% |
| 3 | Grangemouth - Town Centre | 36 | +5 | 2.05% | 4.53% | 2.29% |
| 4 | Bo'ness - Kinneil | 35 | -8 | 2.09% | 4.40% | 2.18% |
| 5 | Falkirk - Grahamston | 33 | -18 | 1.56% | 4.15% | 2.75% |
| 6 | Braes Villages | 33 | +8 | 1.56% | 4.15% | 2.76% |
| 7 | Grangemouth - Kersiebank | 33 | +9 | 1.50% | 4.15% | 2.87% |
| 8 | Falkirk - Middlefield | 31 | -2 | 1.28% | 3.90% | 3.16% |
| 9 | Carse and Grangemouth Old Town | 28 | +8 | 1.19% | 3.52% | 3.06% |
| 10 | Fankerton, Stoneywood and Denny Town | 28 | -2 | 1.15% | 3.52% | 3.16% |
| 11 | Blackness, Bo'ness - Carriden and Grahamsdyke | 27 | +4 | 1.05% | 3.40% | 3.37% |
| 12 | Falkirk - Bainsford and Langlees | 26 | +12 | 1.36% | 3.27% | 2.49% |
| 13 | Falkirk - Camelon East | 24 | -3 | 1.39% | 3.02% | 2.26% |
| 14 | Dunipace | 22 | -1 | 1.30% | 2.77% | 2.21% |
| 15 | Banknock, Haggs and Longcroft | 21 | +4 | 1.22% | 2.64% | 2.25% |
| 16 | Falkirk - Bantaskin | 20 | -2 | 1.18% | 2.52% | 2.21% |
| 17 | Bo'ness - Douglas | 18 | +1 | 0.92% | 2.26% | 2.56% |
| 18 | Falkirk - Merchiston and New Carron Village | 18 | -2 | 0.90% | 2.26% | 2.60% |
| 19 | Polmont | 18 | +8 | 0.90% | 2.26% | 2.60% |
| 20 | Denny - Nethermains | 17 | +5 | 0.89% | 2.14% | 2.50% |
| 21 | High Bonnybridge and Greenhill | 16 | +4 | 1.03% | 2.01% | 2.03% |
| 22 | Laurieston and Westquarter | 16 | +7 | 0.99% | 2.01% | 2.10% |
| 23 | Bonnybridge | 16 | -5 | 0.72% | 2.01% | 2.90% |
| 24 | Grangemouth - Bowhouse | 15 | -1 | 0.73% | 1.89% | 2.67% |
| 25 | Shieldhill | 14 | +5 | 1.31% | 1.76% | 1.39% |
| 26 | Redding | 14 | +11 | 1.00% | 1.76% | 1.83% |
| 27 | Brightons and Wallacestone | 13 | -2 | 0.74% | 1.64% | 2.29% |
| 28 | Reddingmuirhead and Overton | 13 | -4 | 0.72% | 1.64% | 2.35% |
| 29 | Larbert - North Broomage and Inches | 13 | -6 | 0.45% | 1.64% | 3.73% |
| 30 | Head of Muir and Dennyloanhead | 11 | +1 | 0.88% | 1.38% | 1.64% |
| 31 | Hallglen and Glen Village | 11 | +2 | 0.74% | 1.38% | 1.95% |
| 32 | Larbert - South Broomage and Village | 11 | -4 | 0.62% | 1.38% | 2.30% |
| 33 | Stenhousemuir West | 10 | -2 | 0.65% | 1.26% | 2.00% |
| 34 | Maddiston and Rumford | 10 | 0 | 0.46% | 1.26% | 2.86% |
| 35 | Falkirk - Camelon West | 9 | 0 | 0.71% | 1.13% | 1.66% |
| 36 | Bo'ness - Newtown | 9 | -2 | 0.64% | 1.13% | 1.84% |
| 37 | Falkirk - Lochgreen and Lionthorn | 9 | +3 | 0.60% | 1.13% | 1.94% |
| 38 | Carron | 8 | -2 | 0.70% | 1.01% | 1.50% |
| 39 | Stenhousemuir East | 8 | -4 | 0.51% | 1.01% | 2.03% |
| 40 | Falkirk - Tamfourhill | 7 | -7 | 0.49% | 0.88% | 1.87% |
| 41 | Stenhousemuir - Antonshill | 5 | -5 | 0.33% | 0.63% | 1.95% |
| 42 | Carronshore | 2 | -1 | 0.17% | 0.25% | 1.51% |
Where the % of homes is lower than % of long term empty homes, it indicates areas with above average levels of empty homes.
Sources
Small Area Statistics on Households and Dwellings | National Records of Scotland (nrscotland.gov.uk)
Housing statistics: Empty properties and second homes – gov.scot (www.gov.scot)