East Renfrewshire Local Authority
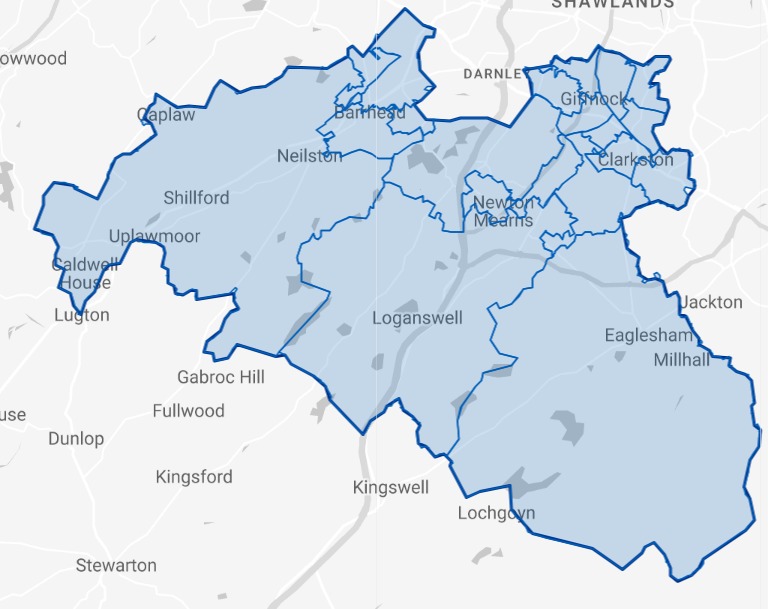
Figures published by National Records of Scotland show that East Renfrewshire had 124 long-term empty homes in 2023. The map and table below shows how these long term empty homes are distributed across the Local Authority area.

• 0.30% of East Renfrewshire ’s homes were long term empty in 2023, compared to 1.70% in Scotland as a whole.
• The number of homes empty for 12+ months in East Renfrewshire is not published in figures reported by Scottish Government.
The EHOs for East Renfrewshire:
Andrew Reid (07833716729)
Please click on the map above to go to the Statistics.Gov.UK page for East Renfrewshire . You can find out the location of each of the Intermediate Data Zones by clicking on 2011 Intermediate Zones under Locations on that page
| Intermediate Data Zones | Number of Long-term Empty Homes | Increase or decrease 2022-2023 | % of Properties LTE | % of ER LTE homes | % of ER homes | |
|---|---|---|---|---|---|---|
| 1 | Crookfur and Fruin | 19 | -3 | 0.57% | 15.32% | 8.17% |
| 2 | North Giffnock and North Thornliebank | 14 | -8 | 0.78% | 11.29% | 4.40% |
| 3 | Mearnskirk and South Kirkhill | 9 | +2 | 0.26% | 7.26% | 8.45% |
| 4 | Auchenback | 8 | -1 | 0.44% | 6.45% | 4.45% |
| 5 | Dunterlie, East Arthurlie and Dovecothall | 7 | 0 | 0.23% | 5.65% | 7.60% |
| 6 | Cross Stobbs | 6 | -1 | 0.37% | 4.84% | 3.95% |
| 7 | Merrylee and Braidbar | 6 | -1 | 0.30% | 4.84% | 4.88% |
| 8 | Eaglesham and Waterfoot | 6 | -1 | 0.28% | 4.84% | 5.29% |
| 8 | Clarkston and Sheddens | 6 | +1 | 0.26% | 4.84% | 5.63% |
| 10 | Neilston and Uplawmoor | 6 | -1 | 0.21% | 4.84% | 7.04% |
| 11 | Whitecraigs and Broom | 5 | -1 | 0.35% | 4.03% | 3.55% |
| 12 | Netherlee | 5 | -6 | 0.27% | 4.03% | 4.60% |
| 13 | Arthurlie and Gateside | 5 | -1 | 0.24% | 4.03% | 5.18% |
| 14 | Lower Whitecraigs and South Giffnock | 4 | -5 | 0.31% | 3.23% | 3.15% |
| 15 | Stamperland | 4 | +2 | 0.27% | 3.23% | 3.60% |
| 16 | South Thornliebank and Woodfarm | 4 | -2 | 0.24% | 3.23% | 4.09% |
| 17 | Mearns Village, Westacres and Greenfarm | 4 | +1 | 0.17% | 3.23% | 5.62% |
| 18 | Busby | 3 | +1 | 0.18% | 2.42% | 4.00% |
| 19 | North Kirkhill | 2 | -1 | 0.14% | 1.61% | 3.51% |
| 20 | Williamwood | 1 | -2 | 0.09% | 0.81% | 2.85% |
Where the % of homes is lower than % of long term empty homes, it indicates areas with above average levels of empty homes.
Sources
Small Area Statistics on Households and Dwellings | National Records of Scotland (nrscotland.gov.uk)
Housing statistics: Empty properties and second homes – gov.scot (www.gov.scot)
