
Clackmannanshire Local Authority
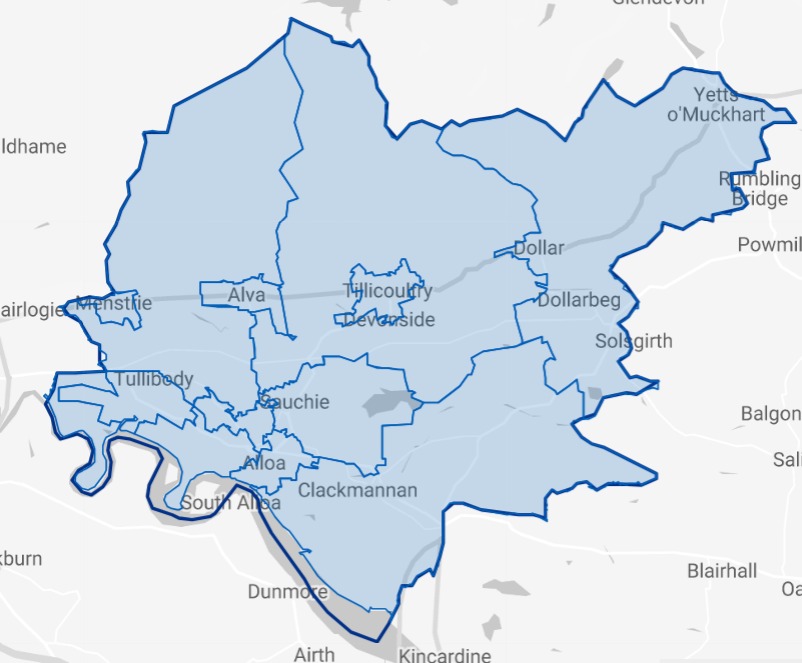
Figures published by National Records of Scotland show that Clackmannanshire had 220 long-term empty homes in 2023. The map and table below shows how these long term empty homes are distributed across the Local Authority area.
• 0.94% of Clackmannanshire’s homes were long term empty in 2023, compared to 1.70% in Scotland as a whole.
• 46.36% (102) of Clackmannanshire’s long term empty homes have been empty for longer than one year.
• Clackmannanshire accounts for 0.36% of homes empty for more than 1 year in Scotland.
Clackmannanshire does not have an empty homes officer. For empty homes enquiries please contact 0344 515 1941 or email [email protected]
Please click on the map above to go to the Statistics.Gov.UK page for Clackmannanshire. You can find out the location of each of the Intermediate Data Zones by clicking on 2011 Intermediate Zones under Locations on that page
| Intermediate Data Zones | Number of LTE Homes | Increase or Decrease 2022-2023 | % Properties LTE | % of Clack LTE | % of Clack Homes | |
|---|---|---|---|---|---|---|
| 1 | Tillicoultry | 30 | -4 | 1.23% | 13.64% | 9.62% |
| 2 | Alloa South and East | 29 | -13 | 1.06% | 13.18% | 10.79% |
| 3 | Dollar and Muckhart | 28 | +9 | 1.70% | 12.73% | 6.50% |
| 4 | Alloa North | 28 | +1 | 0.95% | 12.73% | 11.67% |
| 5 | Clackmannan, Kennet and Forestmill | 22 | +5 | 0.91% | 10.00% | 9.55% |
| 6 | Alloa West | 21 | -5 | 1.20% | 9.55% | 6.91% |
| 7 | Alva | 16 | +3 | 0.62% | 7.27% | 10.20% |
| 8 | Sauchie | 15 | +1 | 0.60% | 6.82% | 9.85% |
| 9 | Fishcross, Devon Village and Coalsnaughton | 11 | +2 | 1.00% | 5.00% | 4.36% |
| 10 | Tullibody South | 8 | -7 | 0.41% | 3.64% | 7.63% |
| 11 | Menstrie | 7 | 0 | 0.56% | 3.18% | 4.90% |
| 12 | Tullibody North and Glenochil | 5 | -9 | 0.25% | 2.27% | 8.02% |
Where the % of homes is lower than % of long term empty homes, it indicates areas with above average levels of empty homes.
Sources
Small Area Statistics on Households and Dwellings | National Records of Scotland (nrscotland.gov.uk)
Housing statistics: Empty properties and second homes – gov.scot (www.gov.scot)